Ethereum’s price has slipped lower over recent weeks as other markets have also slumped. Simultaneously, activity on the blockchain itself has slowed as yield farming opportunities have dried up, with many reaching a point where they became grossly unsustainable.
This may not be the end of the world, though, as fundamental and technical trends suggest ETH may soon revert higher.
Ethereum Social Volume Plunges as Price Slips Lower
Due to a slowdown in ETH’s price action and usage of the cryptocurrency, the volume of Ethereum-related social media posts has slumped.
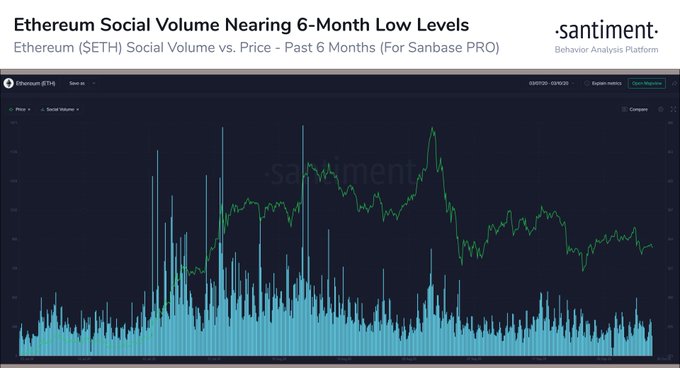
Blockchain analytics firm Santiment reports that as of October 3rd, Ethereum social volume is nearing six-month lows. While this may logically lead some to believe that this means that ETH is primed to move lower, Santiment notes that it may indicate that ETH is about to enter a pivotal accumulation phase.
This accumulation phase could precede a move higher as the extremely low social activity pertaining to the cryptocurrency may suggest capitulation amongst investors and an imminent reversal on the return of inflows.
“The social volume of #Ethereum is nearing 6-month low levels across social discourse platforms as traders look elsewhere for volatility to trade. However, assets like $ETH typically see the biggest buy opportunities when crowds are disinterested.”
Chart of ETH's price action over the past few months with a social volume analysis by crypto research and data firm Santiment (@Santimentfeed on Twitter)
Fundamental and Technical Trends Support ETH Price Appreciation
A confluence of technical and fundamental trends indicate that ETH will continue its path of growth in the near future.
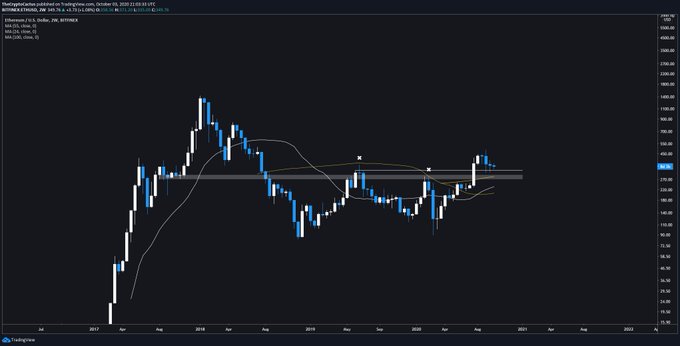
As reported by Bitcoinist previously, one analyst referencing the chart below recently said:
“Personally with so much uncertainty in the market it is very possible we see a $300 region retest, that said honestly HTF structure is looking great, lots of EMA support below us… In 2018/2019 the 55 EMA was consistently resistance, price now trending well above!”
Chart of ETH's price action over the past few years with analysis by crypto trader Crypto Cactus (@TheCryptoCactus on Twitter).
Chart from TradingView.com
This optimism has been echoed by other market participants.
A trader called Logan Han, who regularly posts extremely profitable trades on Binance, made similar observations to the chartist above. He also noted that Ethereum holding the low-$300s and high-$200s in the recent correction is pivotal for the bull case.
Han added that Ethereum is forming a falling wedge formation in the near term. Such patterns often precede upward breakouts.
Ethereum seems to be in a fundamentally and technically positive long-term position though a move lower in the Bitcoin price could result in an ETH correction as well.
Photo by Jakob Owens on Unsplash
Price tags: ethusd, ethbtc
Charts from TradingView.com
Critical Social Volume Trend Shows Ethereum Could Be in Accumulation
Credit: Source link
source https://cryptonews.wealthsharingsystems.com/2020/10/critical-social-volume-trend-shows-ethereum-could-be-in-accumulation/


No comments:
Post a Comment