To many, determining which direction Bitcoin trends from here is a coin toss. One trader shared the image below with the caption: “You guys still trading this garbage? I’m not doing anything until one of these lines gets hit.”
That’s to say, the analyst isn’t taking a trading position in Bitcoin because he has no idea where it will go first.
BTC range chart shared by chartist/technician Byzantine General (@Byzgeneral on Twitter). Chart from TradingView.com
Unfortunately for bulls, the evidence is starting to melt that a correction is more likely than a rally.
Bitcoin Could Be Subject to a Steep Correction, Indicator Shows
Bitcoin’s price action has effectively been flat over the past eight weeks. But a crucial indicator suggests that a bearish undercurrent has formed as BTC has consolidated around $9,000.
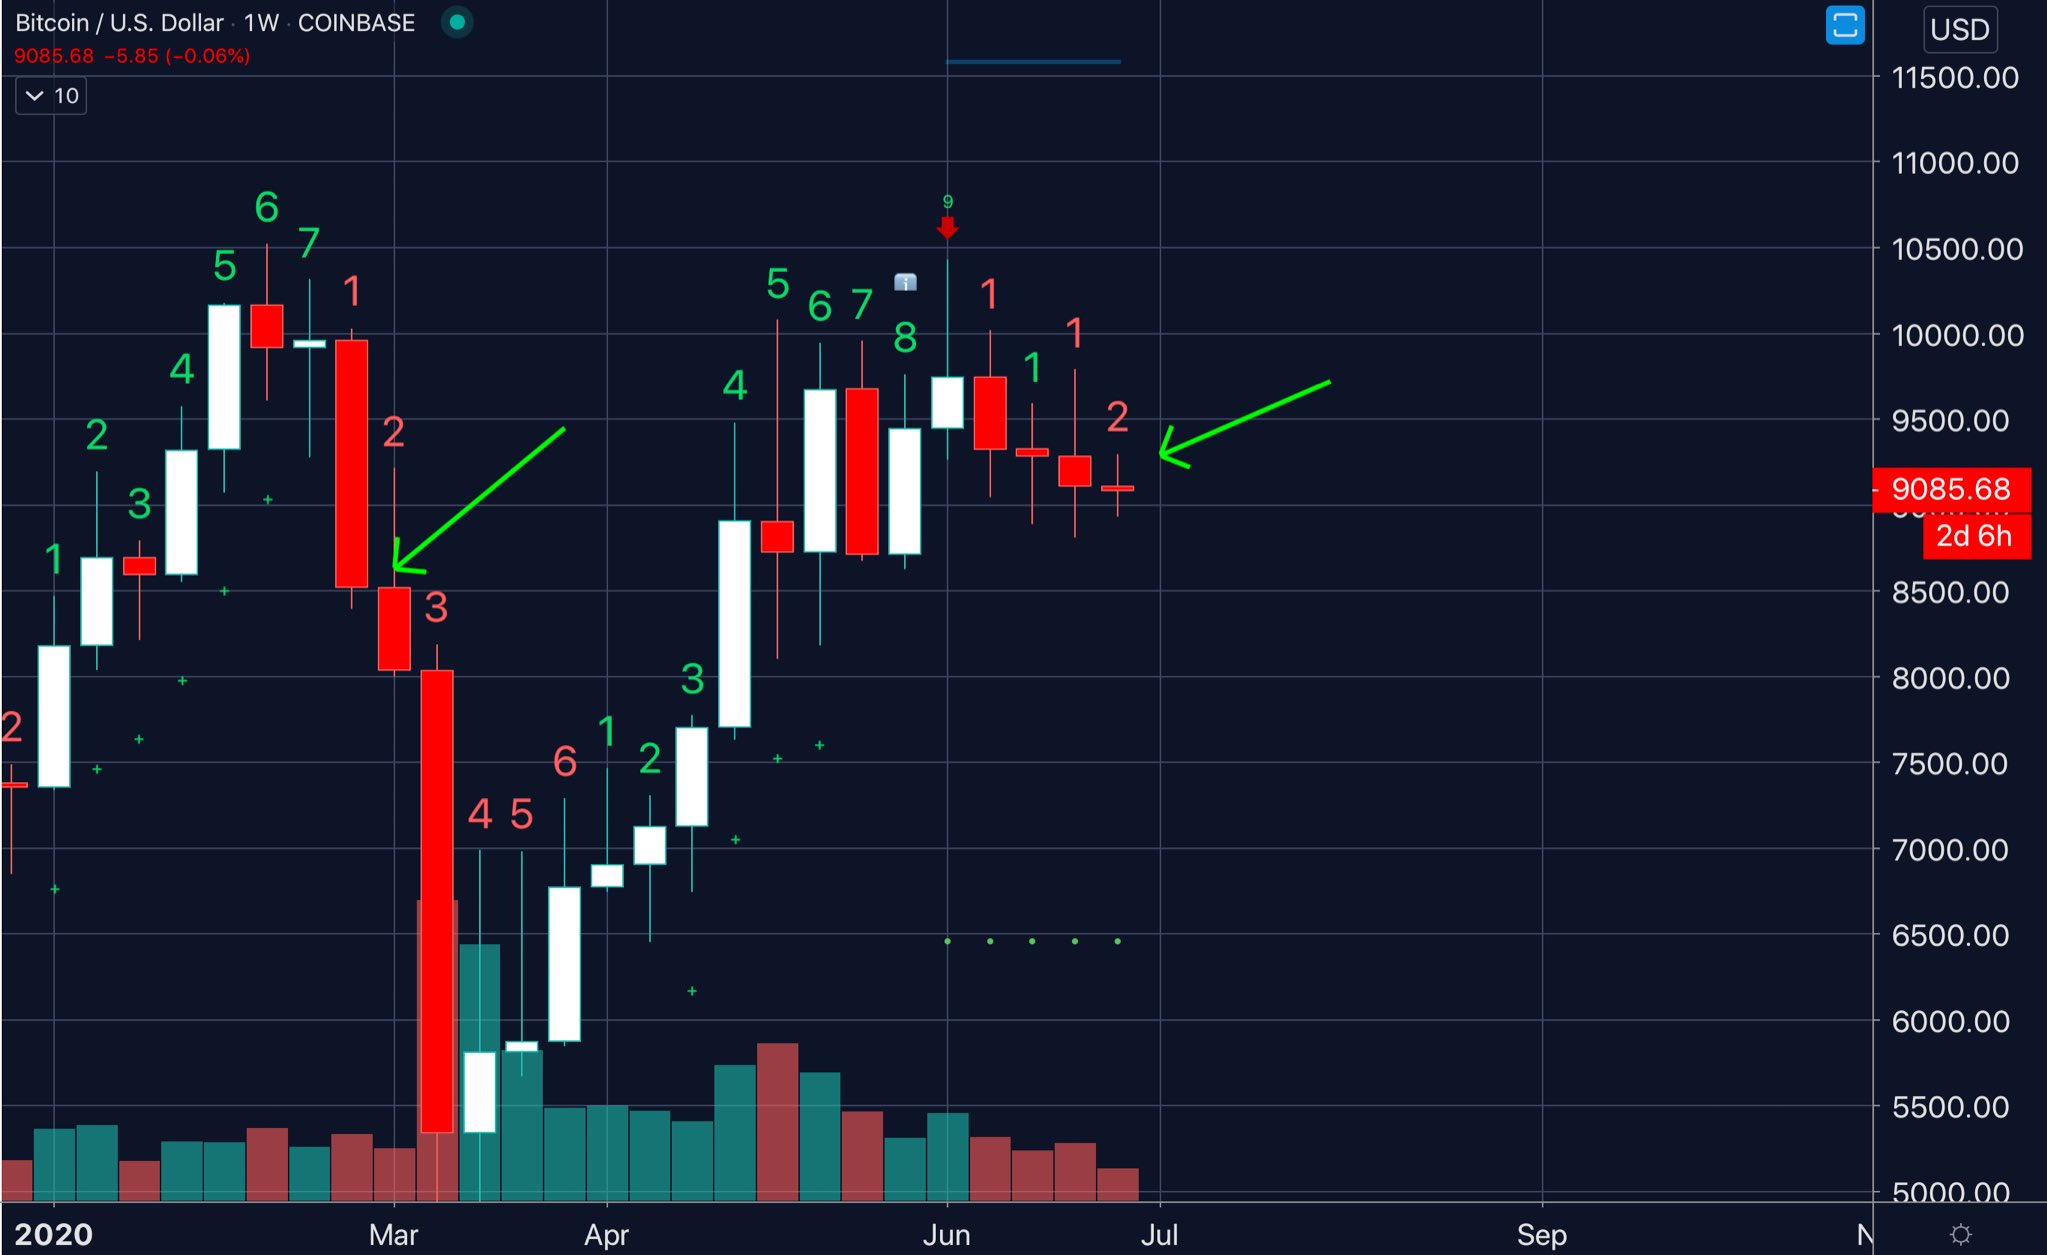
A trader shared the below chart on July 3rd, showing that BTC is forming a bearish trend as per the Tom Demark Sequential. The TD Sequential is a time-based indicator that signals trends and inflection points in an asset’s rallies or corrections.
“With a couple more days left in the weekly candle, Bitcoin is on a Red 2 below a Red 1 which would signal a short trade on a weekly timeframe, all in the context after a perfected Green TD9 the first week of June.”
They added that Bitcoin last looked like this per the TD Sequential in early March, prior to the crash to $3,700.
Bitcoin price chart shared by crypto trader "Big Chonis" (@Bigchonis on twitter). Chart from TradingView.com
The bearish signal poised to be registered by the TD Sequential isn’t the only signal tying Bitcoin’s recent price action to the February top.
Not the Only Bearish Sign
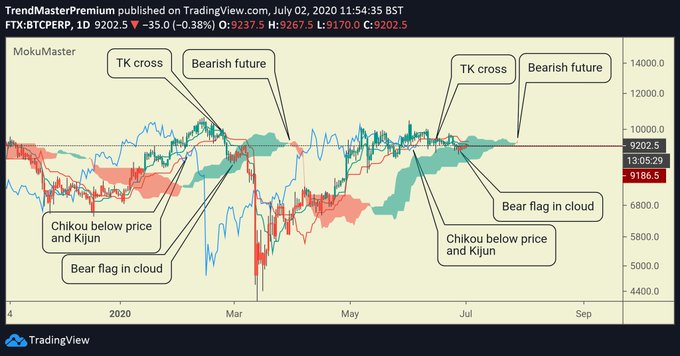
Below is a chart from an Ichimoku Cloud specialist showing that Bitcoin is looking structurally similar to how it looked prior to the March crash.
As the trader annotated on the chart below, four Ichimoku Cloud signals that were present then are present now.
Bitcoin Ichimoku Cloud analysis by trader "Ichimoku Scholar" (@Ichimokuscholar on Twitter). Chart from TradingView.com
Considering the confluence, it is no wonder that institutional traders involved with Bitcoin are being careful.
As reported by NewsBTC previously, CME futures data shows that institutions have been building a net short position in Bitcoin. One trader shared the image below at the end of June, showing that “institutional traders” on the CME are cumulatively shorting 2,038 contracts.
The last time institutional traders were as bearish as they are now was in February, prior to the crash to $3,700.
BTC price chart with CME's Commitment of Traders report data. Chart from TradingView.com; made by Byzantine General (@Byzgeneral on Twitter).
Featured Image from Shutterstock
Price tags: xbtusd, btcusd, btcusdt
Charts from TradingView.com
A Signal Last Seen Before Bitcoin Plunged to $3,700 Is About to Return
Credit: Source link
source https://cryptonews.wealthsharingsystems.com/2020/07/a-signal-last-seen-before-bitcoin-plunged-to-3700-is-about-to-return/


No comments:
Post a Comment