Monday, 30 November 2020

Why The Double Top Narrative In Bitcoin Doesn’t Make Sense

Bitcoin price just set a new all-time high today, and then immediately dropped $500 and is trading below the former peak once again. Murmurs of a “double top” scenario have been making rounds across the speculation-driven crypto community.

However, one well-known crypto trader and analyst explains why such a scenario is nearly impossible, due to the requirements involved in confirming the technical chart pattern.

Bitcoin Sets New All-Time High, Drops $800 Immediately After

Bitcoin price set a new all-time high of $19,863 on Binance and beat the former peak on other spot crypto exchanges like Coinbase and Bitstamp, certifying the historic moment.

Within minutes of the achievement, however, the leading cryptocurrency by market cap plunged by $800 and is back holding onto $19,000 as support.

The rejection here after a new peak was set, and even before as Bitcoin has previously stopped short of a new high, sparked discussion and wild speculation over a possible “double top” scenario.

Related Reading | Bitcoin Rally Isn’t Just Institutional Driven, Emerging Markets Are Voting For Revolution

Double tops occur when an asset peaks at or around the same resistance level at the height of two rallies. The resistance that is created, can often be unbreakable and causes a complete reversal – hence being called a “top.”

But like any chart patterns, they must meet certain requirements to “confirm” as “valid,” and according to one well-known crypto trader, the scenario is just nonsense.

bitcoin double top ascending triangle

A Bitcoin double top requires bottom support to break down | Source: BTCUSD on TradingView.com

Crypto Trader Breaks Down Why BTC Won’t Double Top

According to DJ, analyst, and trader Scott Melker, who goes by The Wolf Of All Streets moniker on Twitter and elsewhere, a “double top” is extremely unlikely.

Melker explains that the requirements to confirm such a pattern as valid would require a break of the swing low between each of the two tops.

The swing low being Bitcoin’s bottom at $3,200. If Black Thursday couldn’t break it, most likely nothing will, and it becomes even more unlikely with the cryptocurrency so close to breaking out into a bull market.

Additionally, Melker outlines that the target of such a structure would be roughly -$16,000 – as in a negative price per BTC.

Unlike oil that requires a hefty cost to store, Bitcoin prices would not fall into negative territory. Zero is of course possible but is at this point less feasible than $100,000 per coin.

Bitcoin topping here isn’t all that bad, either. The first-ever crypto-asset could be forming a massive ascending triangle formation – a bullish technical continuation pattern.

bitcoin double top ascending triangle An ascending triangle could be forming as Bitcoin is ahead of schedule | Source: BTCUSD on TradingView.com

According to a comparison with the last crypto market cycle, Bitcoin is currently far ahead of schedule in terms of setting a new all-time high. With Bitcoin halving theories based on a four-year block reward reduction mechanism, market cycles are expected to follow a somewhat similar trajectory.

Related Reading | Here’s What Will Happen To Altcoins Once Bitcoin Breaks $20,000

This could imply that either there will another stretch of consolidation around current prices for the next three to six months, or that the macroeconomic environment due to the pandemic and out-of-control money printing, could be having that dramatic of an impact.

If that’s the case, being concerned with a “top” around $20,000 could be as foolish as Melker makes it out to be, as the cryptocurrency’s momentum will take it much higher before the next peak is in.

Featured image from Deposit Photos, Charts from TradingView.com


Credit: Source link


source https://cryptonews.wealthsharingsystems.com/2020/12/why-the-double-top-narrative-in-bitcoin-doesnt-make-sense/
XRP Continues Ascent With 10% Surge as Bitcoin Consolidates

XRP has surged 10% higher in the past 24 hours as Bitcoin has begun to consolidate in the mid-$19,000s. The crypto market saw a strong surge higher seemingly as a result of new institutional inflows, which were previously absent as a result of the Thanksgiving holiday weekend.

BTC is up around 6% in the past 24 hours, having pushed to $19,500. The coin traded as high as $19,900 on some top exchanges, though there is some mispricing as a result of some discrepancies between futures and spot markets.

XRP is expected to move higher in the days ahead if Bitcoin continues its ascent. There are some divided over BTC’s short-term prospects, though, as the coin faces extremely high funding rates on top futures platforms.

Related Reading: Here’s Why Ethereum’s DeFi Market May Be Near A Bottom

The XRP Outlook

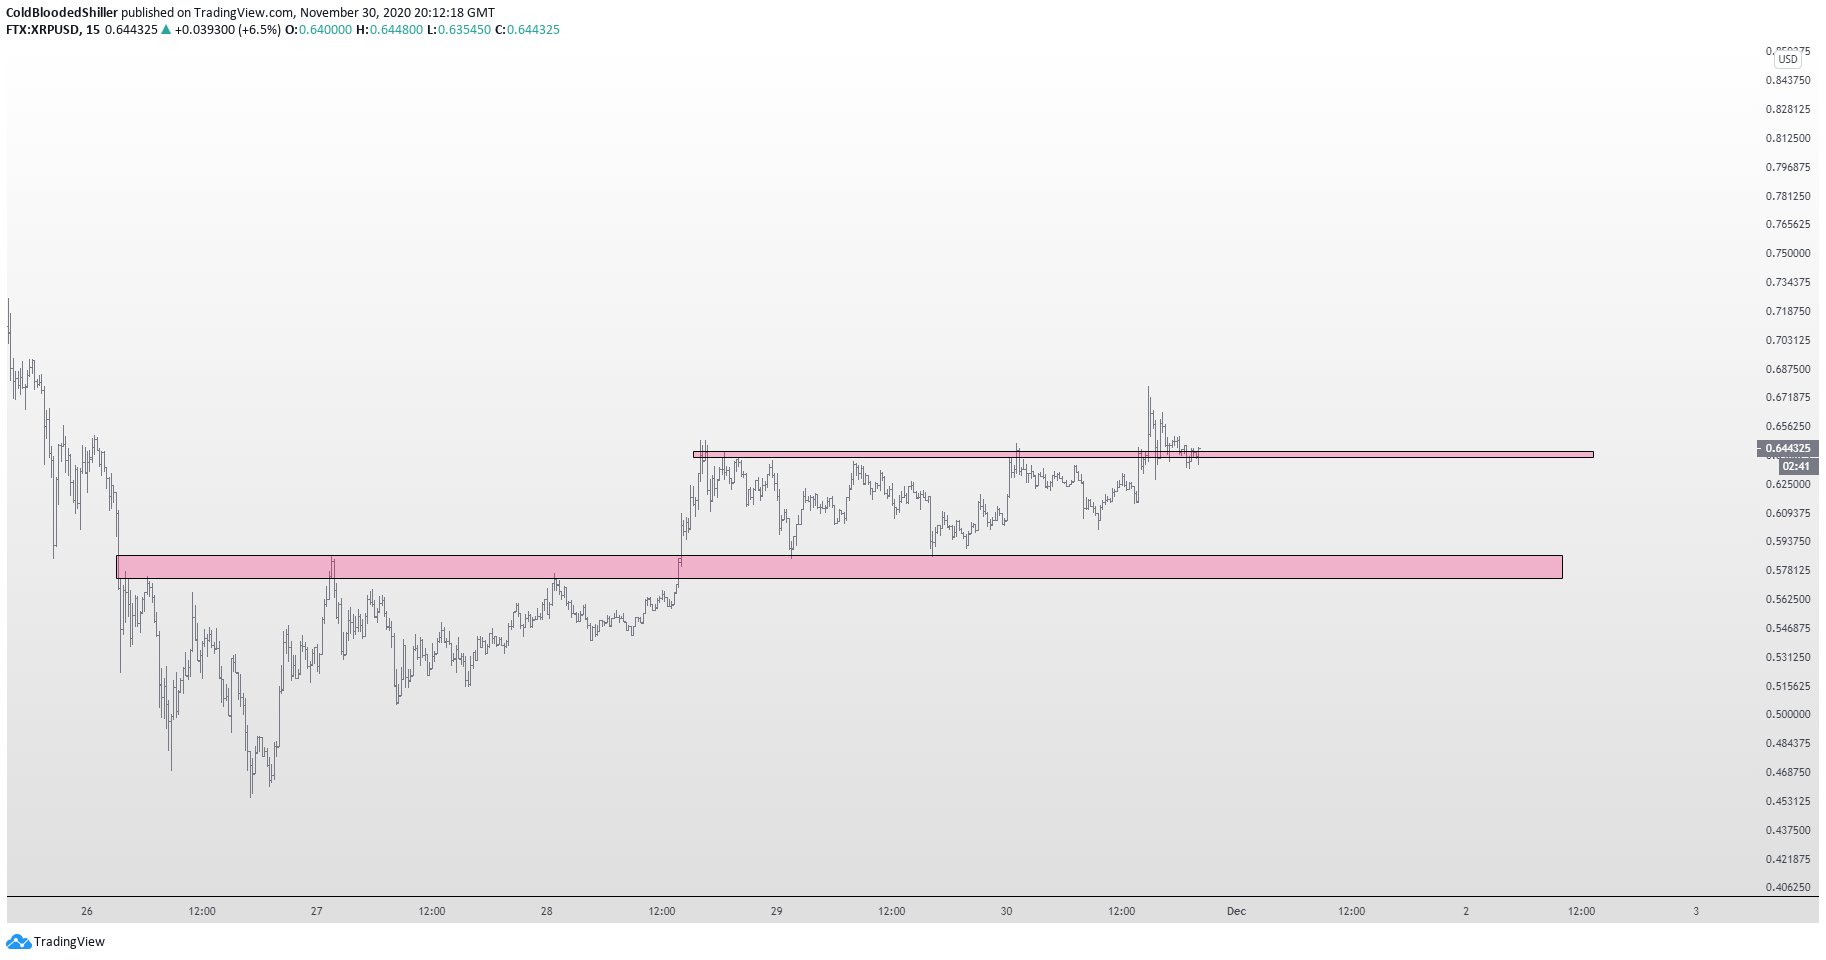
Analysts are bullish on XRP as the coin manages to consolidate despite an extremely strong rally last week. XRP has begun to hold a key resistance level on a short-term basis, which an analyst says may precede a further rally to the upside.

The chart below shows this trend playing out. As can be seen, XRP is in the midst of consolidating above a crucial technical level in the near term.

Per the chart, there may not be much resistance until prices far above the current range.

Image

Chart of XRP's price action over the past week with an analysis by crypto trader Cold Blooded Shiller (@ColdBloodShill on Twitter).
Source: XRPUSD from TradingView.com
Related Reading: Tyler Winklevoss: A “Tsunami” of Capital Is Coming For Bitcoin

How Does Bitcoin Look? 

XRP’s performance is somewhat predicated on that of Bitcoin.

Analysts are mixed as Bitcoin has stalled under $20,000, though the fundamentals of the coin remain bullish. This should provide XRP with a boost moving forward.

Commenting on the drop last week, Willy Woo, a prominent on-chain analyst and technical analyst, said:

“Margin longs will be spanked until they go short. Was bullishness was way overheated. Exchange flows are neutral; spot sellers are matched with buyers. Fundamentals a great. The next few weeks? A great time to scoop cheap coins for 2021.”

Analysts are also confident that institutional buying pressure will send Bitcoin skyrocketing soon enough.

Related Reading: 3 Bitcoin On-Chain Trends Show a Macro Bull Market Is Brewing
Featured Image from Shutterstock
Price tags: xbtusd, btcusd, btcusdt
Charts from TradingView.com
XRP Continues Ascent With 10% Surge as Bitcoin Consolidates

Credit: Source link


source https://cryptonews.wealthsharingsystems.com/2020/12/xrp-continues-ascent-with-10-surge-as-bitcoin-consolidates/

Why Bitcoin price has not hit a new all-time high — Just yet

The price of Bitcoin (BTC) reached $19,873 on Coinbase on Nov. 30, breaking above $19,000 in a surprising recovery rally. Although many in the cryptocurrency sector a celebrating BTC achieving an all-time high, it has not just yet.

On Coinbase, the price of Bitcoin hit its peak at $19,891 in December 2017. The all-time high price on Coinbase is particularly important because it has consistently remained as the top U.S. exchange for the past several years.

BTC/USD monthly chart at Coinbase. Source: TradingView

Also, some top global exchanges like Binance launched in mid-2017. An argument could be made that an exchange that has been around since 2012 carries more significance in terms of historical price data and to date, Coinbase remains one of the primary exchanges used by retail investors.

Bitcoin’s all-time highs vary across exchanges

2017 was a tumultuous period for cryptocurrencies. By the time Bitcoin achieved a new all-time high, it saw 30% to 50% price swings in a week as the cryptocurrency exchange market showed a lack of liquidity.

Currently, the record highs differ by nearly $300 between exchanges. For instance, on Kraken and Bitstamp, BTC peaked at $19,660 and $19,666, respectively. Today, BTC price hit a new all-time high at both exchanges.

On Binance and Huobi, BTC reached a top at $19,799 and $19,867, both of which were also achieved on Nov. 30.

At the time of writing, Bitcoin is yet to see a new record high on Bitfinex, Coinbase, and Gemini, which are also coincidentally known as the exchange for whales due to their high liquidity.

In 2017 Coinbase was a leading exchange in terms of trading volume, and in the minds of many traders, seeing the price surpass its previous all-time high would provide further confirmation that a bull market has officially started. 

For many traders, $20,000 is the barrier that needs to be broken as it will officially concretize a new all-time high for the top-ranked digital asset.

A pseudonymous trader known as “Bitcoin Jack” pinpointed Bitfinex as the most liquid exchange during this ongoing rally. Hence, considering that Gemini and Coinbase’s record highs are near Bitfinex, the $19,873 level makes an accurate all-time high. He said:

“Careful out there as liquidity to open interest ratios took a hit across most exchanges. It means that, until liquidity gets replenished, the amount of liquidity vs OI is relatively low allowing for less contained cascades to both sides As always, Finex is the liquidity king.”

What’s next for Bitcoin price?

On-chain analysts, including CryptoQuant CEO Ki Young Ju, predicted that whales would try front-run the all-time high and apply significant selling pressure.

As Bitcoin neared its record high on Coinbase, a sudden sell-off occurred, taking BTC to as low as $18,998 within two hours.

Following the heightened level of volatility and a whale-induced sell-off, the futures market’s open interest took a hit, and exchange order books have been hindered.

There are two scenarios in the near term that Bitcoin could see after its first attempt to break out of its all-time high.

First, the momentum may continue in the Asian markets during their morning session and this could catalyze buyer demand to increase again.

Second, Bitcoin could consolidate under the all-time high at $19,873, possibly ranging between $19,000 and $19,873. This scenario is the most ideal for BTC to see a sustainable rally, as it would prevent the derivatives market from getting overheated.


Credit: Source link


source https://cryptonews.wealthsharingsystems.com/2020/11/why-bitcoin-price-has-not-hit-a-new-all-time-high-just-yet/

XRP Could See a Strong Push Higher as Bulls Degrade Key Resistance

Ever since XRP broke out of the tight multi-year trading range that it was previously stuck in, the cryptocurrency has been caught within a strong uptrend that has shown no signs of slowing down.

Bulls have been in full control of the previously embattled cryptocurrency, and the recent rebound seen across the entire market appears to be boosting XRP’s technical outlook as well.

The crypto is now in the process of moving up towards a key resistance level that has long been hampering its price action.

The visit to this level comes in the midst of Bitcoin and Ethereum both entering full-fledged bull trends, with BTC setting fresh all-time highs earlier today before facing a rejection at $19,800 that appears to have sparked another consolidation phase.

It remains unclear whether this consolidation phase will be short-lived or persist in the days to come, but the resistance between $19,500 and $20,000 does appear to be degrading.

One analyst is now noting that XRP is poised to rally higher against this backdrop of bullishness seen by BTC and other digital assets.

He believes that a break above $0.65 is all that is needed for it to gain some immense momentum and begin rallying higher.

XRP Reaches Crucial Resistance as Bull Market Ignites

At the time of writing, XRP is trading up just over 7% at its current price of $0.65. This is where it has been trading throughout the past few days, with the selling pressure here being significant.

Bulls were able to defend its recent back-test of its $0.45 support, a positive technical sign. Couple this with the market-wide bullishness seen as of late, and it does seem as though XRP may soon explode higher.

Analyst Claims XRP is Poised to Explode Higher

While sharing his thoughts on XRP’s current technical outlook, one trader explained that he expects it to see some serious near-term upside.

He notes that the recent test of the $0.45 level confirmed it as support and could boost it higher in the days to come.

“XRP: Higher timeframe support around $0.45 massively held for support. Therefore, strong bounce and looking at clear resistance at $0.65. If that breaks, likely continuation towards new highs.”

XRP

Image Courtesy of Michaƫl van de Poppe. Source: XRPUSD on TradingView.

So long as Bitcoin remains stable and pushes higher in the days and weeks ahead, there’s a strong possibility that XRP will aim for $1.00 next – assuming it can break above $0.65.

Featured image from Unsplash.
Charts from TradingView.


Credit: Source link


source https://cryptonews.wealthsharingsystems.com/2020/11/xrp-could-see-a-strong-push-higher-as-bulls-degrade-key-resistance/

XRP price now eyeing $1.00 after key support level holds, BTC price soars

While Bitcoin (BTC) is facing a potential new all-time high, other coins are showing strength as well. One of those coins is XRP, which has been going vertical in the previous weeks. 

XRP’s price surged from $0.22 to a high of $0.78 during the month of November, which immediately ended up in a massive correction toward $0.45.

Let’s take a look at the XRP price charts to determine whether this was an entry opportunity before the next leg up.

The crucial zone around $0.45 holds as support

XRP/USDT 1-day chart. Source: TradingView

The daily chart of XRP is showing clear support and resistance zones. Within such a heavy pump, the levels to watch can be derived from the daily time frame.

In this case, the first massive support zone is around the $0.45 barrier. XRP corrected toward this zone as the price of Bitcoin dropped to $16,200 on Thanksgiving day. 

The chart shows a clear support bounce, as the price has gained more than 40% since.

If $0.45 failed to sustain support, the next support zone would have been around the $0.30 area, which is the previous resistance zone that was likely to be flipping support.

What are the new resistances if the XRP rally continues?

The next resistance zone now to break is the $0.69 area, which is crucial before $1.00 can come into play.

XRP/USD 1-day chart. Source: TradingView

There are a few useful tools to determine the potential resistance zones on the XRP chart. One of them is the Fibonacci extension tool.

The recent top is the “1” number on the Fibonacci extension tool, and the bottom around $0.20 as the “0.”

Therefore, the next likely resistance zone can be measured around the 1.618 Fibonacci level at $1.13. Similarly, the second zone is the zone around $1.70, which is the 2.618 Fibonacci level.

However, the first resistance zone between $1.08 and $1.18 is an important resistance zone, as it also acted as resistance throughout the 2017 cycle, as the chart shows. One can argue that a run toward $1.08 to $1.18 is likely once the area at $0.70 breaks.

The key level to watch for BTC/XRP

XRP/BTC 1-day chart. Source: TradingView

Once a price breaks above resistance, the next thing one would like to see is the previous resistance becoming support — if you’re a bull, that is.

The BTC/XRP chart is showing such a critical level (highlighted in green) that can flip to support. During the end of 2019 and the beginning of 2020, this area served as the range low and support for a substantial period.

However, it failed to sustain that support, leading to a drop to 0.00001500 thereafter.

With the recent breakout to 0.00004000 sats, the bulls will want to see a support/resistance flip of the 0.00002400 sats area. If that holds, XRP is likely to continue running toward the $1.00 barrier.

Lower time frame levels to watch on the XRP chart

XRP/USD 1-hour chart. Source: TradingView

The XRP/USD chart is showing an apparent breakout above $0.65. As long as that area sustains support and confirms the breakout, continuation toward $0.74 is on the table.

However, failing to break the $0.65 area means that a drop toward $0.55 will become the likely scenario.

The higher time frames give a clearer indication of where XRP is located in the market cycle. A multiyear downtrend was broken to the upside, meaning that dips will likely be considered as entry opportunities for traders.

With this in mind, if XRP holds $0.45 as support, continuation toward $1.00 is likely, particularly if Bitcoin price hits a new all-time high.

The views and opinions expressed here are solely those of the author and do not necessarily reflect the views of Cointelegraph. Every investment and trading move involves risk. You should conduct your own research when making a decision.


Credit: Source link


source https://cryptonews.wealthsharingsystems.com/2020/11/xrp-price-now-eyeing-1-00-after-key-support-level-holds-btc-price-soars/

Bitcoin Targets $25,000 Fib Level With New All-Time High Set

Today, Bitcoin price set a new all-time high record. While that statement certainly speaks for itself, it does beg the question: what comes next?

Given the fact that this hurdle was the one the entire investor class was watching, and it is now out of the way, the most logical next target could be $25,000. Here’s why this number is significant and why there’s a strong probability that price heads there next.

All-Time High Broken, Bitcoin Price To Return To Price Discovery Mode

For nearly three full years, crypto investors have been waiting for this day and wondering if it would even happen. Holding Bitcoin has been a rocky ride for those that got in at the peak of the last bubble.

After the cryptocurrency tapped the current level, it fell to $3,000 a year later. A revisit back to that key level earlier in the year sealed the deal on a new uptrend and canned any chances of the cryptocurrency dropping lower.

Related Reading | Here’s What Will Happen To Altcoins Once Bitcoin Breaks $20,000

From that bounce caused a sharp uptrend and now – as of today – Bitcoin price has set a new record.

The leading cryptocurrency by market cap is now below the previous high, but a spike higher today set a new all-time high record. The feat is likely to make waves across the finance space, and lure in another wave of investors, until the asset peaks and does it all again.

But before the bull market truly takes off, the next logical level, according to one crypto analyst, is right below $25,000 at $24,800.

bitcoin btcusd btc

The 1.272 Fibonacci extension is the next logical target for Bitcoin price | Source: BTCUSD on TradingView.com

Why Cryptocurrencies And Other Assets Respond To Fibonacci Levels

According to crypto analyst Jamie Holmes, the next target resides at the 1.272 Fibonacci extension level. Beyond there, 1.618, 2.618, and 3.618 sit at $30,000, $50,000, and roughly $75,000 respectively, and could be next after the first extension is taken out.

Holmes accurately called for the retest of ATH after a “bullish saucer” formed on monthly timeframes. Now he’s pointing to $25,000 next.

During the last bull market, Bitcoin rose as high as the 19.618 Fibonacci level, which could suggest that these early extensions will be barely a blink for the now unstoppable cryptocurrency.

Related Reading | Fibonacci Day: How To Use Math To Trade Bitcoin And Altcoins

It isn’t exactly clear why Fibonacci ratios and their retracement levels and extensions act as support and resistance, but they do for all asset types.

Breaking through the 0.618 Fib retracement level at $13,800 is what set off the recent bullish impulse and send the cryptocurrency to a new all-time as of today.

The 0.618 level could once again become a target to watch, and this time act as support for any major corrections that follow from here.

Featured image from Deposit Photos, Charts from TradingView.com


Credit: Source link


source https://cryptonews.wealthsharingsystems.com/2020/11/bitcoin-targets-25000-fib-level-with-new-all-time-high-set/

‘Classic top setup’? Bitcoin price flash crashes on Kraken after all-time high

Bitcoin (BTC) reached a new all-time high on various exchanges on Nov. 30, but one record, in particular, hit the headlines for a different reason.

Data from cryptocurrency exchange Kraken shows BTC/USD hit its highest ever price on its order book — then dove to $16,600 in seconds.

Kraken BTC price dumps $3,000

The reason for the crash, which will have liquidated a large number of positions and caused considerable pain for many a speculator, was likely what is known as a “stop-loss run.”

Stop-loss runs involve large-volume traders who intentionally place large sell orders at a specific price point, then target where they think a large number of stop-loss positions reside. In this case, the target was around $16,600, near the location of last week’s local bottom.

The result is a cascade of selling pressure that very quickly delivers the result, if successfully estimated, only for the market to subsequently rebound once the process is over.

Kraken XBT/USD 1-minute chart showing crash. Source: TradingView

Liquidity risk is always a given factor in exchange trading, and Kraken’s one-minute wick down by $3,000 aptly demonstrates why traders should exercise caution around significant price points.

Another explanation, or possibly one that contributed to the event, was investors choosing to exit at near $20,000 in order to avoid the costs of a sudden reversal at resistance.

Bollinger cautions over “classic top formation”

“OK, time to pay attention, $BTCUSD. That is a classic top setup,” John Bollinger, creator of the Bollinger Bands volatility indicator, warned.

“No confirmation yet and the setup could easily be overrun, but wise traders should wash their glasses.”

When asked by a Twitter user if this is a local top or whether Bitcoin’s price will go down from here, he responded that “For now, a potential local top…”

Beyond Kraken, meanwhile, Bitstamp also reached its own all-time high at $19,869, with BTC/USD then falling toward $19,000, a level that the pair reclaimed just hours ago.

“For those who are feeling bullish about #Bitcoin, today is the day you’ve been waiting for,” exchange Binance meanwhile summarized.


Credit: Source link


source https://cryptonews.wealthsharingsystems.com/2020/11/classic-top-setup-bitcoin-price-flash-crashes-on-kraken-after-all-time-high/

Bubble or a drop in the ocean? Putting Bitcoin’s $1 trillion milestone into perspective

On Feb. 19, Bitcoin’s (BTC) market capitalization surpassed $1 trillion for the first time. While this was an exciting moment for investors...