Ripple found support near $0.2320 and recovered higher above $0.2380 against the US Dollar. XRP price is consolidating gains and it could rally towards $0.2500.
Ripple recovered nicely above the $0.2350 and $0.2380 resistance levels against the US dollar.
The price is now trading above the $0.2400 resistance and the 100 hourly simple moving average.
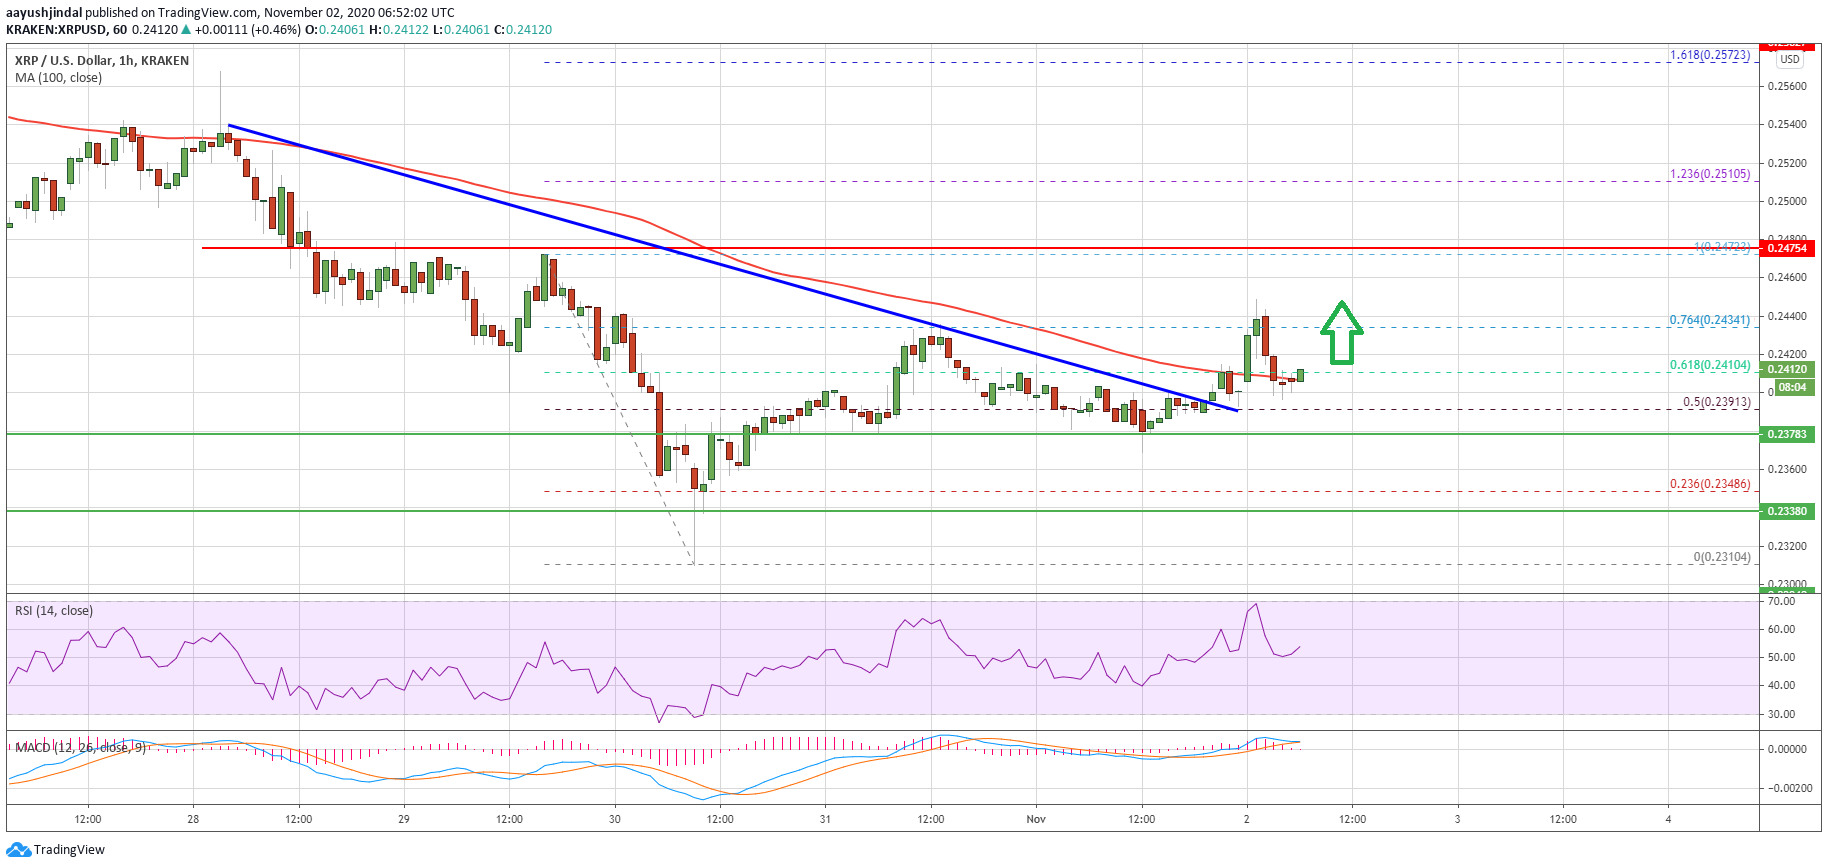
There was a break above a key bearish trend line with resistance near $0.2400 on the hourly chart of the XRP/USD pair (data source from Kraken).
The pair is likely to continue higher if it clears the $0.2420 resistance zone.
Ripple Price is Showing Positive Signs
This past week, we saw a sharp decline in ripple below the $0.2400 support area. XRP price even broke the $0.2350 support and the 100 hourly simple moving average. It traded as low as $0.2310 and recently started a solid recovery wave.
There was a break above the $0.2350 and $0.2380 resistance levels. The price even climbed above the 50% Fib retracement level of the downward move from the $0.2472 high to $0.2310 low.
More importantly, there was a break above a key bearish trend line with resistance near $0.2400 on the hourly chart of the XRP/USD pair. The price is now trading above the $0.2400 resistance and the 100 hourly simple moving average.
Source: XRPUSD on TradingView.com
An initial hurdle on the upside is near the $0.2420 level. The next resistance is near the 76.4% Fib retracement level of the downward move from the $0.2472 high to $0.2310 low. If there is a clear break above the $0.2420 and $0.2450 resistance levels, there is a risk of more upsides towards the $0.2480 and $0.2500 resistance levels.
Key Supports For XRP
The first key support for ripple is near the $0.2400 level and the broken trend line. The next key support is forming near the $0.2380 zone.
A successful break below the $0.2380 support level could put a lot of pressure on the bulls. In the stated case, the price may possibly revisit the $0.2320 support zone.
Technical Indicators
Hourly MACD – The MACD for XRP/USD is losing momentum in the bullish zone.
Hourly RSI (Relative Strength Index) – The RSI for XRP/USD is currently riding and it is above the 50 level.
Major Support Levels – $0.2400, $0.2380 and $0.2320.
Major Resistance Levels – $0.2420, $0.2450 and $0.2500.
Chainlink (LINK) has undergone a strong rally since the lows set in September. The price of the leading cryptocurrency currently trades for $11.50. LINK is up 3% in the past 24 hours, outperforming Bitcoin, XRP, Binance Coin, and a series of other top altcoins.
Even still, LINK is trading just under 50% below its all-time high above $20. On-chain data shows that investors in Chainlink remain extremely bullish, as they are accumulating the coin en-masse.
Related Reading: Here’s Why Ethereum’s DeFi Market May Be Near A Bottom
Chainlink (LINK) Investors Bullish, On-Chain Data Shows
According to blockchain analytics firm Santiment, a blockchain data and analytics firm, the leading cryptocurrency is still being accumulated en-masse.
The firm noted on October 30th that Chainlink’s top 100 non-exchange/contract addresses have accumulated 34.32 million LINK over the past year alone. This number has begun to taper off slightly but is still up massively over recent months.
“If this isn’t the depiction of steady accumulation for #Chainlink’s top 100 non-exchange whales in the past year, we don’t know what is. $LINK’s offline increase in tokens at this rate truly shows confidence in the asset from those with most at stake.”
If this isn’t the depiction of steady accumulation for #Chainlink‘s top 100 non-exchange whales in the past year, we don’t know what is. $LINK‘s offline increase in tokens at this rate truly shows confidence in the asset from those with most at stake. https://t.co/8we3ZGkAy9 pic.twitter.com/0aUYFvklSC
Chainlink is still down 5% in the past week, though, following a majority of other altcoins. Bitcoin’s rapid ascent has left many altcoins stranded as all capital and attention is focused on the leading cryptocurrency.
Related Reading: Tyler Winklevoss: A “Tsunami” of Capital Is Coming For Bitcoin
New Products and Partnerships
Chainlink’s Verifiable Random Function (VRF) product has seen a number of integrations over recent weeks. VRF is a “provably-fair and verifiable source of randomness designed for smart contracts” that allows developers to bypass sometimes questionable oracles that service lottery-based or randomized smart contract systems. Chainlink VRF was recently integrated into PoolTogether, a “no-loss” DeFi lottery system built on Ethereum.
Also, Genesis Volatility, a premier crypto derivatives data provider, has begun to run its own Chainlink node. Announcing this move, the Chainlink team wrote:
“Crypto-derivatives data provider @GenesisVol is running its own #Chainlink node to sell their signed data directly to smart contracts. #DeFi now has access to signed data on volatility, open interest, volume & more when creating derivatives products.”
LINK is likely to follow Bitcoin’s overall trajectory in the weeks ahead. If Bitcoin continues to push higher, the cryptocurrency may continue to consolidate or even push higher.
Related Reading: 3 Bitcoin On-Chain Trends Show a Macro Bull Market Is Brewing
Featured Image from Shutterstock
Price tags: xbtusd, btcusd, btcusdt
Charts from TradingView.com
Despite 50% Drop From $20 Highs, Chainlink Whales Remain Bullish
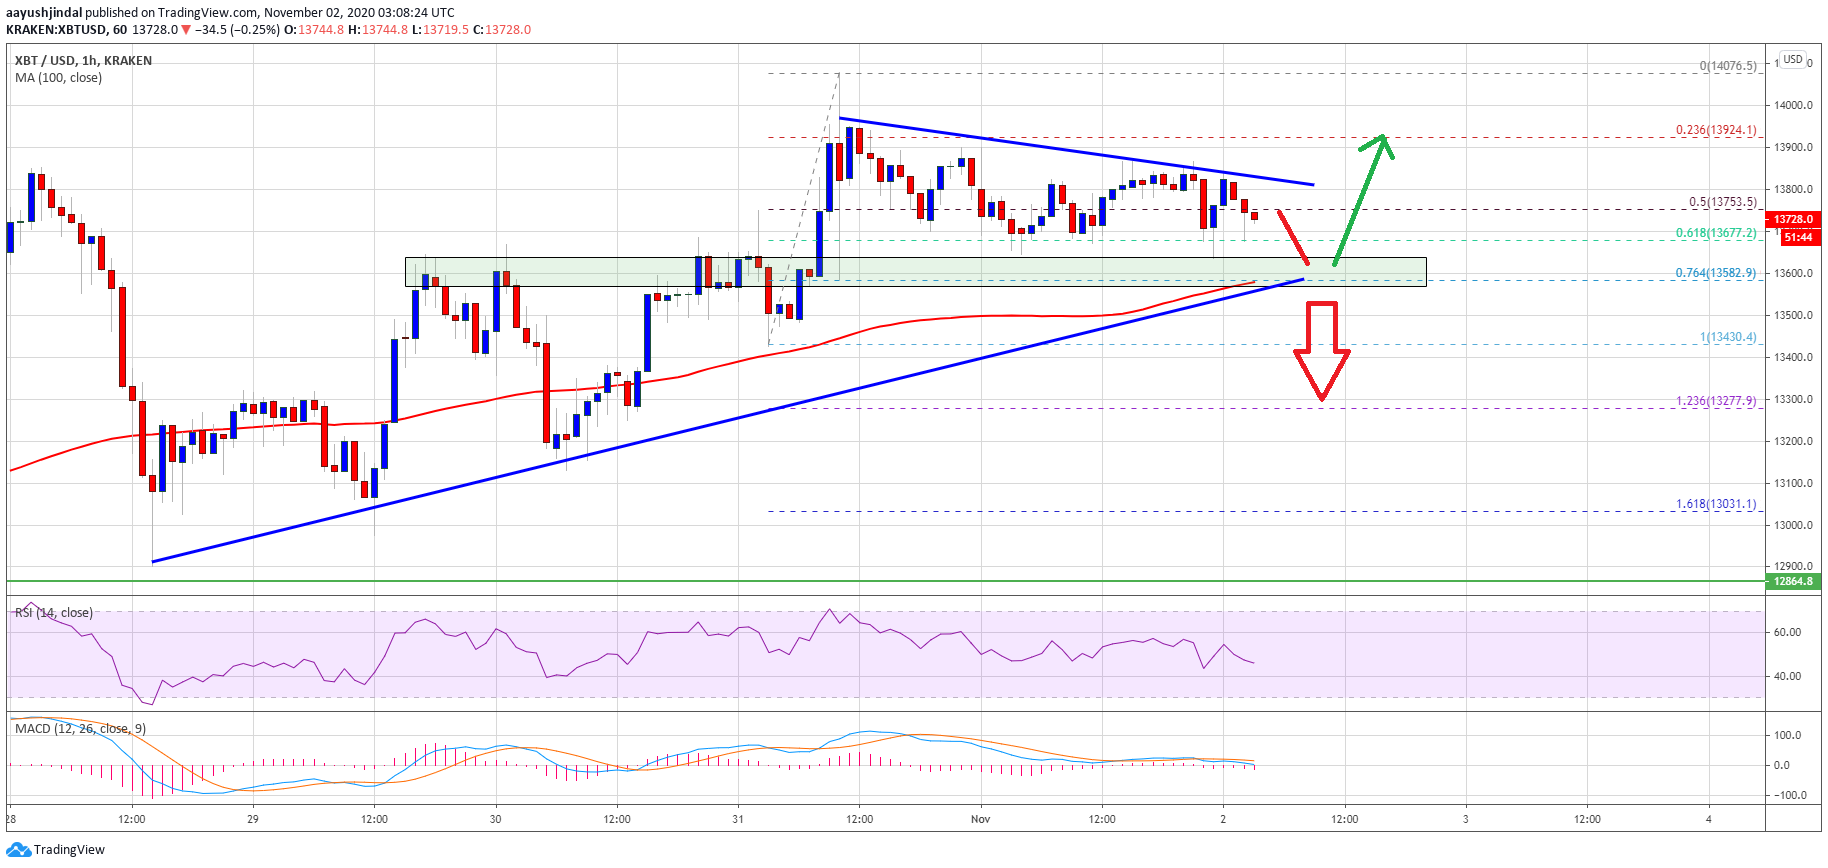
Bitcoin price traded above the $14,000 resistance before correcting lower against the US Dollar. BTC is currently consolidating gains and it must stay above the 100 hourly SMA for a fresh increase.
Bitcoin started a downside correction after forming a high near the $14,080 level.
The price is trading above the $13,600 support and the 100 hourly simple moving average.
There is a major bullish trend line forming with support near $13,580 on the hourly chart of the BTC/USD pair (data feed from Kraken).
The pair must stay above $13,550 and the100 hourly simple moving average to continue higher.
Bitcoin Price Holding Gains
This past week, there was a steady rise in bitcoin price above the $13,500 resistance. BTC broke the $13,800 resistance and settled well above the 100 hourly simple moving average.
The price even spiked above the $14,000 resistance before starting a downside correction. There was a break below the $13,800 support level. The price also traded below the 50% Fib retracement level of the upward move from the $13,430 swing low to $14,076 high.
However, the price remained well bid above the $13,600 and $13,500 support levels. There is also a major bullish trend line forming with support near $13,580 on the hourly chart of the BTC/USD pair.
Source: BTCUSD on TradingView.com
The trend line is close to the 61.8% Fib retracement level of the upward move from the $13,430 swing low to $14,076 high. The 100 hourly simple moving average is also following the trend line at $13,850.
As long as bitcoin price is above the trend line support and the 100 hourly SMA, it could start a fresh increase. On the upside, an initial resistance is near the $13,800 level. The main resistance is near the $14,000 level. A successful close above the $14,000 resistance could open the doors for a sharp rally towards $14,400 or even $14,500.
Downside Break in BTC?
If bitcoin fails to stay above the $13,600 and $13,580 support levels, there is a risk of a downside break. The first key support below the 100 hourly SMA is near the $13,500 level.
A downside break below the $13,500 level is likely to spark a fresh increase in selling. In the stated case, the bears may perhaps attempt a test of the $13,000 support level in the coming days.
Technical indicators:
Hourly MACD – The MACD is slowly moving in the bearish zone.
Hourly RSI (Relative Strength Index) – The RSI for BTC/USD is now well below the 50 level.
Major Support Levels – $13,580, followed by $13,500.
Major Resistance Levels – $13,800, $13,880 and $14,000.
Bitcoin’s price action heading into election season has been incredibly positive, with bulls taking full control of its trend as they attempt to push it above its 2019 highs of $13,800.
Each break above this price level has resulted in it seeing strong selling pressure, which could indicate that it will continue struggling to gain momentum as it consolidates below this key level.
The benchmark cryptocurrency’s strength heading into the presidential elections this week has been quite surprising, as it had created significant turbulence within the stock market that had led many investors to expect Bitcoin to see some weakness.
That being said, one analyst is now noting that he expects Bitcoin to put in a temporary top around this price level and potentially begin drifting lower.
He notes that this should provide altcoins with some much-needed momentum that allows them to gain some ground against the benchmark crypto.
Because they have been severely underperforming BTC as of late, smaller digital assets have quite a way to go before they can recapture their market dominance.
Bitcoin Faces Mounting Resistance as Altcoins Continue Drifting Lower
At the time of writing, Bitcoin is trading down marginally at its current price of $13,800. This is around the price at which it has been trading throughout the past few days.
Earlier this week, it was able to rally as high as $14,100, which marked a multi-year high. The move to this level was fleeting, as the selling pressure here was intense and rapidly pushed its price back below $13,800.
BTC was able to close the week above this level, which allowed it to post the highest monthly candle close ever.
Analyst: Altcoins Could Benefit from a BTC Pullback
One analyst is noting that Bitcoin forming a local top at its $14,100 highs could prove to be highly beneficial for altcoins.
“I think bitcoin is putting in a temporary top. Price action to the upside when futures are closed gives me further indication that we’ll see a continued pullback into the election. Hopefully after we’ll see capital go into alts,” he said.
Altcoins have been severely underperforming the benchmark crypto, but it remains unclear what might catalyze a rotation from BTC and into altcoins.
In particular, the DeFi sector has been struck hard by Bitcoin’s uptrend, which means that it could see the largest returns when altcoins begin bouncing back.
Featured image from Unsplash.
Pricing data from TradingView.
Bitcoin’s price action as of late has been incredibly bullish, but altcoins like XRP and Ethereum have continued their descents as traders and investors alike both set their sights on the benchmark cryptocurrency.
One trader is now noting that XRP – which is currently trading at multi-year lows against its BTC trading pair – could be on the cusp of seeing some massive upside.
He believes that the prolonged bout of consolidation seen by the embattled altcoin could mark an accumulation phase followed by a parabolic move higher.
On-chain data seems to confirm that this is a realistic possibility.
According to one analytics platform, XRP’s whale count has started climbing higher, indicating that some large buyers are beginning to gain exposure to the cryptocurrency.
Despite this trend, the lack of any fundamental shifts in the cryptocurrency’s underlying strength indicates that any immediate price pumps will be fleeting and potentially followed by serious downside.
Until Ripple can direct more utility to the token, it may continue facing some immense inflows of selling pressure with every pump.
At the time of writing, XRP is trading down marginally at its current price of $0.24, which is around where it has been trading throughout the past few days, weeks, and months.
Bulls have been virtually non-existent as of late, unable to spark any sustainable uptrends as it remains caught within a multi-year consolidation phase.
According to the analytics firm Santiment, there have been inflows of new whales to the cryptocurrency, suggesting that a small group of wealthy buyers expects it to see some upside in the near-term.
“Ripple’s whale count has spiked the past 6 months, with many in high-tier brackets of XRP held. Since April, holders with: 100K – 1M: 14,525 to 17,387 whales (+19.7%). 1M – 10M: 1,307 to 1,336 whales (+2.2%). 10M+: 280 to 309 whales (+10.4%)”
Image Courtesy of Santiment.
Analyst: The Token Could Soon See a 100%+ “Scam Pump”
While sharing his thoughts on where XRP might trend next, one analyst explained that he is watching for a move significantly higher in the days and weeks ahead.
“Expecting one of those scamp pumps on XRP very soon. Definitely room for 100%+,” he said while pointing to the below chart.
Image Courtesy of Livercoin. Source: XRPUSD on TradingView.
Where altcoins like XRP trend in the weeks ahead will undoubtedly depend largely on Bitcoin.
Featured image from Unsplash.
Charts from TradingView.
Ethereum has seen shaky price action over the past few weeks, failing to pass notable technical levels.
BTC currently trades for $13,800 despite Ethereum only trading for $390.
Analysts think that Ethereum may resume its ascent shortly.
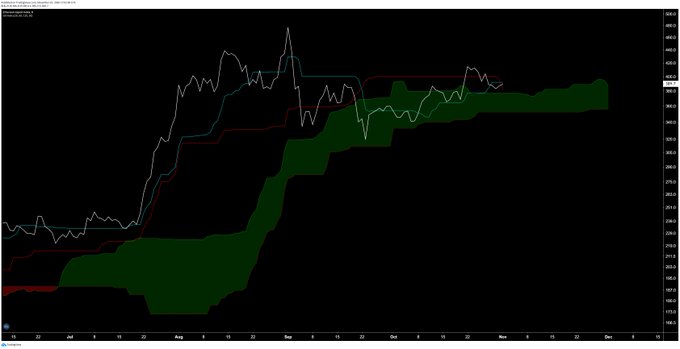
One analyst noted recently that Ethereum has seen its fourth-ever bullish TK re-cross above the Ichimoku Cloud.
Ethereum Could Soon See Rally as Crucial Bull Signal Forms
Ethereum has seen shaky price action over the past few weeks despite Bitcoin pushing to new year-to-date and multi-year highs at $14,100. BTC currently trades for $13,800 despite Ethereum only trading for $390: for context, ETH traded as high as $490 this past summer while Bitcoin only peaked at $12,500.
Despite this price performance, analysts are starting to think that Ethereum could see a strong move higher in the months ahead that may eclipse the previous rally.
One crypto-asset analyst shared the chart below, which shows that Ethereum has seen its fourth-ever bullish TK re-cross above the Ichimoku Cloud. This is a rare technical signal that suggests the trend of an asset is bullish.
Should history repeat itself, ETH could soon see a greater rally.
Last time this signal was seen was toward the end of 2018, when Ethereum was trading around $200-300. Should history rhyme, Ethereum will see an exponential surge in the months ahead.
The signal’s previous instances also marked the start of notable rallies.
This bullish sentiment is in line with that of other analysts, who believe that ETH will eventually follow Bitcoin to the upside. Whether or not it will be able to outperform BTC, though, is another question.
Chart of ETH's price action over the past few months with analysis by crypto trader
Josh Olzewicz (@Carpenoctum on Twitter). Source: ETHUSD from TradingView.com
ETH2 On Its Way
Supporting Ethereum’s chances at moving higher, the ETH2 upgrade is nearing.
According to Trustnodes, Ben Edgington, an ETH 2.0 developer at ConsenSys, believes that the cryptocurrency upgrade may be closer than what some have initially said:
“Danny said that deployment had been pushed back slightly to allow the audit of the Blst crypto library to be completed first. I don’t know why this was a blocker as neither the deposit contract nor the official deposit tooling use that library,” Edgington said.
Analysts think that the launch of ETH2 will drive the coin higher as it will imbue ETH with a staking premium.
Featured Image from Shutterstock
Price tags: ethusd, ethbtc
Charts from TradingView.com
Last Time Ethereum Formed This Signal, It Rallied 600% in 3 Months
Bitcoin (BTC) has rallied about 90% year-to-date and has risen close to 191% from its March lows. The rise has been gradual without much fanfare, which suggests that crypto believers are the ones who have been buying in 2020.
October’s monthly close at $13,798.99 is the highest ever, surpassing the December 2017 close at $13,789.68. The strong performance of Bitcoin may now attract the momentum players and the speculators who look to benefit from the strength.
If that happens, then Bitcoin could pick up momentum and surprise investors to the upside. This could result in traders selling their altcoins to invest in Bitcoin. Hence, the altseason looks to be over in the short-term.
Three of the top-five cryptocurrencies analyzed today may offer a trading opportunity to the upside while the other two may continue to decline further. Let’s watch the critical levels that may indicate the start of a trending move.
BTC/USD
Bitcoin rose above the $13,973.50 overhead resistance and reached an intraday high of $14,101.91 on Oct. 31. Although the bulls failed to sustain the price above the resistance, they have not given up much ground to the downside.
BTC/USD daily chart. Source:TradingView
This suggests that traders are not closing their positions in a hurry because they expect another attempt by the bulls to propel the price above the resistance.
Both the 10-day exponential moving average ($13,309) and the 50-day simple moving average ($11,505) are sloping up and the relative strength index is in the overbought territory. This suggests that the bulls are in command.
If the BTC/USD pair closes above $14,000, the next leg of the uptrend could begin that can reach $16,500.
However, if the bulls again fail to sustain the price above $14,000, then the short-term traders may dump their positions and the bears could initiate short positions. A break below the 10-day EMA will be the first sign that the momentum has weakened.
The bears are likely to gain an upper hand if the pair drops and sustains below the critical support at $12,460.
BTC/USD 4-hour chart. Source:TradingView
The pair is currently attempting to hold above the 10-EMA. If that happens and the bulls succeed in pushing the price above the $13,973.50–$14,101.92 resistance zone, a new uptrend is likely.
However, the bearish divergence on the RSI suggests that the upside momentum is weakening. If the sellers can sink the pair below the 10-EMA, a drop to the 50-SMA and then to $13,000 will be on the cards. The strong support in the $12,750–$13,000 zone could attract buyers.
BNB/USD
Binance Coin (BNB) broke below the $28.50 support on Oct. 30 but managed to bounce from the intraday lows and close above $28.50. However, the doji candlestick pattern on Oct. 31 suggested indecision among the bulls and the bears.
BNB/USD daily chart. Source:TradingView
The bears are currently attempting to resolve the indecision to the downside and gain the upper hand. If the BNB/USD pair breaks and closes below $27.50, it will increase the possibility of a drop to $24.86.
The downsloping 10-day EMA ($29.47) and the RSI in the negative zone suggests that the path of least resistance is to the downside.
Contrary to this assumption, if the price reverses direction and rises above $28.50, then it will suggest a few more days of consolidation.
BNB/USD 4-hour chart. Source:TradingView
The 4-hour chart shows that the recovery from $27.5111 is facing stiff resistance at the 10-EMA. A break below $28 could challenge the $27.50 support, which if broken, the next stop could be $26.50.
Both moving averages are sloping down and the RSI is close to the oversold zone, suggesting an advantage to the bears.
This view will be invalidated if the pair turns around and rises above $29. Such a move will suggest accumulation at lower levels and will increase the possibility of a rise to $30.50.
ADA/USD
Cardano (ADA) broke below the bearish rising wedge pattern on Oct. 26 and plunged to the $0.0891 support. The bulls are currently attempting to defend the support and push the price above the moving averages.
ADA/USD daily chart. Source:TradingView
However, the downsloping 10-day EMA ($0.988) and the RSI below 43 suggest that bears are in control. Therefore, the bounce is likely to face stiff resistance at the moving averages.
If the ADA/USD pair turns down from this resistance, the bears will again try to break the $0.0891 support. Such a move will open the gates for a decline to the next support at $0.0755.
This bearish view will be invalidated if the bulls can push and sustain the price above the moving averages. Such a move could result in a rally to $0.11.
ADA/USD 4-hour chart. Source:TradingView
The bulls have pushed the price above the 10-EMA on the 4-hour chart. The pair could now move up to the 50-SMA where bears may again step in and sell.
Although the 50-SMA is still sloping down, the 10-EMA is attempting to turn up and the RSI has risen to the midpoint, which suggests that the selling pressure has reduced in the short-term.
However, if the pair turns down from the current levels or the 50-SMA, the bears will once again try to sink the price below the $0.0891 support. If they succeed, the next leg of the down move could begin.
BCH/USD
Bitcoin Cash (BCH) has formed a symmetrical triangle, which usually acts as a continuation pattern. However, as this setup suggests indecision among the bulls and the bears, it is better to wait for the price to break above the triangle before taking a directional bet.
BCH/USD daily chart. Source:TradingView
Both moving averages are sloping up and the RSI is above 59, which suggests that the bulls have the upper hand. If the bulls can push and sustain the price above the triangle, the BCH/USD pair could move up to $280 and then to $296.87.
Contrary to this assumption, if the price breaks below the triangle, the BCH/USD pair could drop to the critical support at $242. The 50-day SMA ($239) is placed just below this support, hence, the bulls may buy a drop to this zone.
BCH/USD 4-hour chart. Source:TradingView
The bulls had pushed the price above the resistance line of the symmetrical triangle but they could not sustain the higher levels and the bears have dragged the price back into the triangle.
However, if the pair bounces off the 50-SMA or the 10-EMA, the bulls will make one more attempt to propel the price above the triangle. If they succeed, the momentum could pick up and a rally to $280 is likely.
This positive view will be negated if the price breaks below the moving averages and drops below the symmetrical triangle.
LINK/USD
Chainlink (LINK) has been trading inside an ascending channel for the past few days. Although the pace of rise has been slow, the altcoin has been making successive higher highs and higher lows.
LINK/USD daily chart. Source:TradingView
The LINK/USD pair is currently correcting after turning down from the overhead resistance at $13. Both moving averages have flattened out and the RSI is close to the midpoint, suggesting a balance between supply and demand.
The bulls are likely to purchase the drop to the support line of the channel. If the price rebounds off this support with strength, the bulls may again attempt to push the pair above $13.
This positive view will be invalidated if the bears sink the price below the channel. Such a move could drag the price down to $8.3817 and below that to $7.2869.
LINK/USD 4-hour chart. Source:TradingView
The bulls are currently attempting to defend the uptrend line. If they can push the price above the downtrend line, the pair could start its journey towards $13.
However, the 10-EMA has flattened out and the RSI has been trading in the negative territory, which suggests that bears are attempting a comeback in the short-term.
If the bears can sink the price below the uptrend line, the pair could drop to the support line of the channel. The bulls will attempt to defend this support and if they succeed, the pair may rise to the downtrend line.
The views and opinions expressed here are solely those of the author and do not necessarily reflect the views of Cointelegraph. Every investment and trading move involves risk, you should conduct your own research when making a decision.


 If this isn’t the depiction of steady accumulation for