Sunday, 1 November 2020

Bitcoin monthly candle closes above $13K for the first time since 2017

The monthly candle of Bitcoin (BTC) for October has closed above $13,000 for the first time since December 2017. It comes after both daily and weekly candles all closed above the crucial resistance level.

Traders often use the monthly log chart to evaluate the long-term and macro trend of an asset. On a monthly chart, each candle represents a whole month of trading activity. As such, a Bitcoin monthly log chart typically covers many years of trading activity.

The monthly chart is considered to be one of the main high time frame charts alongside the weekly chart. A clear breakout above an important level, like $13,000, on the monthly chart, indicates a technical breakout.

The monthly price chart of Bitcoin. Source: TradingView.com

$13,000 breakout means $20,000 is near

As Cointelegraph previously reported, Ark Invest’s Cathie Wood emphasized the importance of the $13,000 level.

Wood, who manages $11 billion in assets under management at Ark Invest, said there is little resistance between $13,000 and $20,000. This means if Bitcoin breaks out on a high time frame chart, the probability to rise to a new record-high could get higher. She said:

“That $13,000 [level] is important because if we were to get through that, then in technical terms, there would be very little resistance and we would probably be on our way back to the peaks we saw in late 2017 — so, around $20,000. Now, we’re not sure if that is going to happen. We could stay in a new trading range, just at a little bit of a higher level than the recent six to 10. Maybe we’re in the $10,000 to $13,000 range. Nonetheless, a breakout.”

Although the price of Bitcoin hit $20,000 in 2017 and $13,970 in 2019, the monthly candle never closed above $13,000. This is because BTC saw sharp rejections during both peaks, which then rattled the market.

The recent rally is particularly optimistic because it has shown a more sustainable staircase-like uptrend. As the price rose, it established clear support levels, making the rally more stable.

What do traders expect in the near term?

In the immediate future, traders are readying for a minor pullback. Technically, the monthly chart of Bitcoin closed significantly higher above key short-term moving averages.

A pseudonymous trader known as “Loma” said BTC would likely drop to around $13,100, and resume the rally. The 5-day moving average on the Bitcoin monthly chart is found at $12,256, so a drop to low $13,000s would be healthy for the rally. Loma wrote:

“The gameplan is we’re going to nuke $BTC to $12.9-13.1k, which is just enough for shorts to pile on expecting $12-12.4k retest, then we use them as nuclear fuel to drop the biggest bearnuka candle upwards leaving shorts in Liquidation Land.”

Similarly, Michael van de Poppe, a full-time trader at the Amsterdam Stock Exchange, said a drop to sub-$12,000 could also occur.

As Cointelegraph reported, a Bitcoin pullback entering November would place even more pressure on the altcoin market. Bitcoin has sucked most of the volume from the cryptocurrency market, which means that if BTC goes down, the selling pressure on altcoins would likely intensify.


Credit: Source link


source https://cryptonews.wealthsharingsystems.com/2020/11/bitcoin-monthly-candle-closes-above-13k-for-the-first-time-since-2017/

Big Banks Turning Bullish on Bitcoin Should Have You Worried

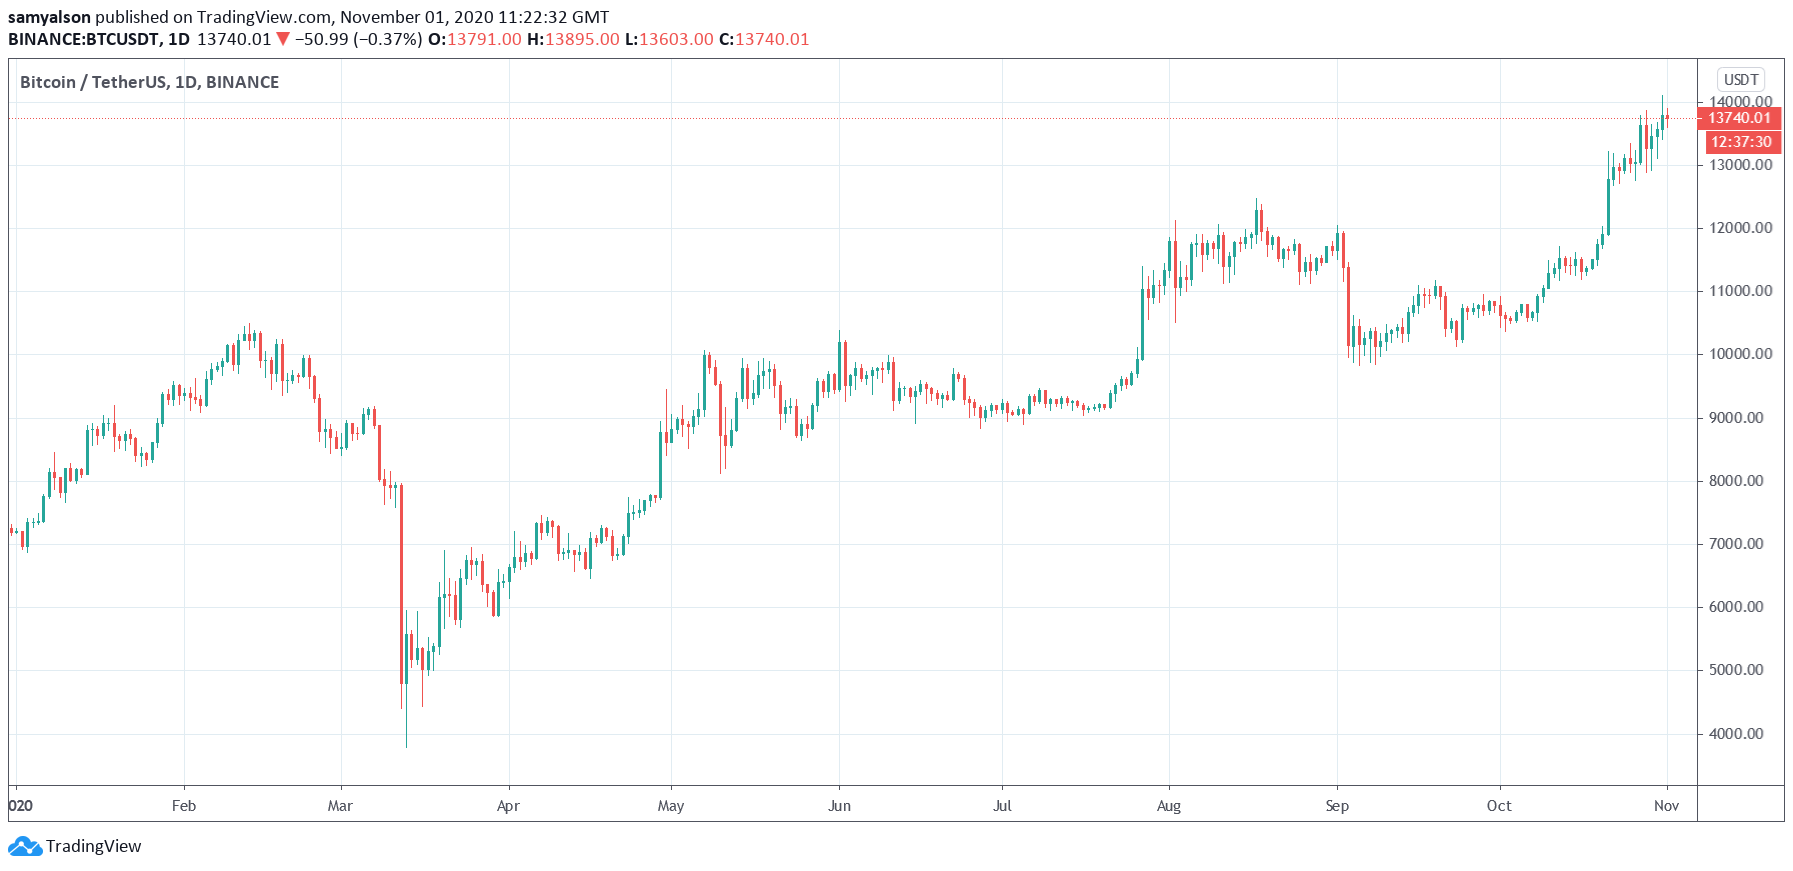
What an October it was for Bitcoin. The number one cryptocurrency by market cap has seen a 30% rise in its price over the last four weeks, making a 17-month high in the process.

Even more impressive is how Bitcoin managed to shrug deteriorating macro-factors to achieve this.

Bitcoin daily chart

Source: BTCUSDT on TradingView.com

This is mostly thanks to a glut of positive sentiment coming from corporate America, who it seems, is starting to warm to the idea of a decentralized store of value network.

MicroStrategy was the first to stamp their approval on Bitcoin. What followed was a series of u-turns from industry-leading firms, some of which, in the past, have been openly vocal about their hatred of Bitcoin.

The most prominent example being JP Morgan, whose CEO, Jamie Dimon, blasted Bitcoin as a fraud. Even going as far as saying Bitcoiners are stupid.

“It’s worse than tulip bulbs. It won’t end well. Someone is going to get killed. It’s just not a real thing, eventually it will be closed.”

Although Dimon has since expressed his regret in saying that, the fact is, Bitcoin and the banks have always had an uneasy relationship.

Bankers Hate Bitcoin

Banking scandals are so commonplace that the public has become apathetic to the issue. The most recent disgrace, the FINCEN leak, showed several central banks complicate in facilitating money laundering.

Documents show Deutsche Bank, JP Morgan, Standard Chartered, HSBC, Barclays, BNY Mellon, and Societe Generale failed to report suspicious banking activity. There has been a widespread denial of any conscious wrongdoing on the part of the banks.

Nonetheless, Rachel Woolley, Director of Financial Crime at Fenergo, said the incident highlighted systemic failures across the entire financial industry.

But, rather than criminalize the perpetrators, regulators chose to punish the banks by issuing fines. The real kicker is that financial penalties are just another cost of business for the banks.

What the FINCEN scandal shows is that banks are a central component of the criminal network. What’s more, judging by the punishments doled out, one that is untouchable as well.

When it comes to Bitcoin and the banks, crypto enthusiast Michael Kern summed it up nicely by saying banks hate anything that interferes with their monopoly on abuse.

“Some of the world’s largest financial institutions want to ban bitcoin to protect society from money laundering and criminal activity, but maybe what they really want is to protect their own monopoly on regulatory and customer abuse.”

Considering that, is it any wonder so many banks have been vocal in panning Bitcoin in the past?

Bankings Making U-Turn on Cryptocurrency

The general feeling is that banks getting on board with Bitcoin is a good thing. But, should we as libertarians and seekers of financial democracy be worried?

As Kern alluded to, the banks have had it their way for so long. And so it’s difficult to imagine they also want financial democracy.

The most likely motive behind the u-turn is not because they see the benefits of transacting peer to peer. Rather, they see the failure to get on board will leave them completely irrelevant.

Banks have manipulated and corrupted every market they’ve been involved with. Just ask any precious metal investor. As such, banks turning bullish on Bitcoin needs seeing for what it is, a ploy to maintain financial authority.

Credit: Source link


source https://cryptonews.wealthsharingsystems.com/2020/11/big-banks-turning-bullish-on-bitcoin-should-have-you-worried/

MicroStrategy’s Bitcoin Bet Reaches Front Page of the Wall Street Journal

One of the biggest Bitcoin stories of the year was the news that MicroStrategy, a business services company, had deployed $425 million into BTC. The move garnered much attention within the cryptocurrency space, with many seeing this as validation of Bitcoin’s store of value properties.

But outside of crypto, few knew about this purchase. The move was widely covered by industry media like NewsBTC, but coverage about this move by mainstream media was somewhat scarce. At least until recently.

Related Reading: Here’s Why Ethereum’s DeFi Market May Be Near A Bottom

Bitcoin Hits Front Page of the WSJ

On Friday morning, the Wall Street Journal published an article covering MicroStrategy’s half-a-billion Bitcoin bet and about the space as a whole. As noted by Su Zhu, CIO of Three Arrows Capital, the story about the investment hit the front page of the Wall Street Journal’s online edition.

While the article was somewhat critical of this move, basing this sentiment around the stagnation of MicroStrategy’s share pre-Bitcoin, many see this as validation of the space. There were likely many Wall Street investors that saw this, along with mainstream investors with subscriptions to the WSJ. It is unclear if this story was printed in the print version of the paper.

This article comes as this space has seen a strong uptick in mainstream media coverage.

CNBC, for instance, has hosted at least four separate TV segments on Bitcoin and cryptocurrencies over the past two weeks. For most of the year, this space barely got a peep on the outlet.

Related Reading: Tyler Winklevoss: A “Tsunami” of Capital Is Coming For Bitcoin

Retail Involvement to Drive BTC Above $20,000

Despite this coverage, retail involvement in the Bitcoin space remains minimal. Hans Hague, head of quantitative strategy at Ikigai, recently shared the chart below. It shows that Bitcoin interest as per Google Trends remains at lows, far from the highs seen in 2017’s bull market.

Analysts say that once retail investors enter the space en-masse as they did during the last cycle, prices will shoot past $20,000 easily. How soon this happens, though, remains to be seen.

But with increased coverage and increased institutional interest, it is likely to play out over the coming months or year.

Related Reading: 3 Bitcoin On-Chain Trends Show a Macro Bull Market Is Brewing
Featured Image from Shutterstock
Price tags: xbtusd, btcusd, btcusdt
Charts from TradingView.com
MicroStrategy's Bitcoin Bet Reaches Front Page of the Wall Street Journal


Credit: Source link


source https://cryptonews.wealthsharingsystems.com/2020/11/microstrategys-bitcoin-bet-reaches-front-page-of-the-wall-street-journal/

The True Bitcoin Breakout Hasn’t Even Happened Yet, Volatility Shows

Bitcoin has undergone a massive rally over the past two weeks. From the lows set after the news broke regarding OKEx, the leading cryptocurrency has surged higher by almost 25%. As of this article’s writing, Bitcoin trades for $13,800.

Despite this rapid move to the upside, not all analysts are convinced that the true Bitcoin breakout has taken place. That’s to say, Bitcoin could soon see even more explosive movement.

Related Reading: Here’s Why Ethereum’s DeFi Market May Be Near A Bottom

Bitcoin Hasn’t Even Seen Its True Breakout Yet

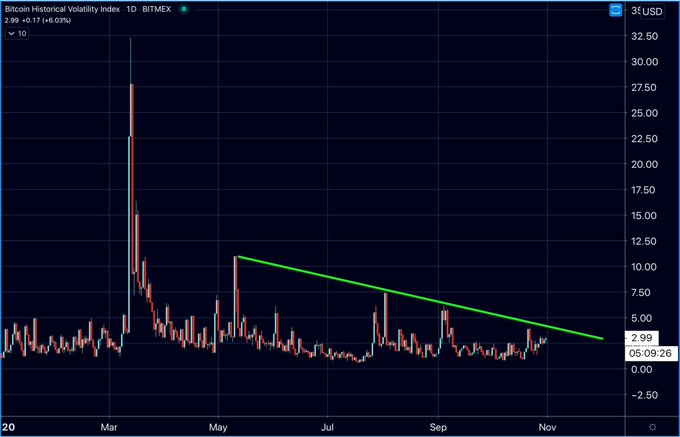
A crypto-asset analyst shared the chart below on October 31st, sharing the sentiment that Bitcoin’s volatility is still barely off the lows. The chart below depicts BTC’s one-day historical volatility index since the start of the year. As can be seen, volatility is still far below the highs that were printed during March’s over 60% correction.

This analysis suggests that once Bitcoin breaks the trendline depicted in green, it will begin a move of macro importance. While current trends suggest that will be a move to the upside, BTC could reverse lower from here if another liquidity crisis were to transpire.

Image

Chart of BTC's historical volatility index since the start of 2020 shared by crypto trader and chartist Big Chonis (@Bigchonis on Twitter).
Source: BTCUSD from TradingView.com

Bitazu Capital’s Mohit Sorout thinks that this volatility results in a strong move to the upside. He recently shared the chart below, showing how low Bitcoin’s macro volatility is right now compared to historical levels.

Related Reading: Tyler Winklevoss: A “Tsunami” of Capital Is Coming For Bitcoin

Price Discovery Above $20,000 May Happen

The actual breakout is expected to take Bitcoin above $20,000. Cryptocurrency analyst “Light” recently shared that the leading cryptocurrency could see “price discovery over $20,000” once retail investors re-enter the space.

“The retail segment is not overheated whatsoever currently. It will be soon though. Price is leading public interest. This is a telltale sign of smart money entering while retail has their heads buried in the sand. Once the latter catches up to the former, we’ll be in price discovery over $20,000.”

Tyler Winkelvoss and other investors in the space think Bitcoin will pass $20,000 by the end of 2020. The leading cryptocurrency is currently a 45% rally away from achieving that milestone.

Related Reading: 3 Bitcoin On-Chain Trends Show a Macro Bull Market Is Brewing
Featured Image from Shutterstock
Price tags: xbtusd, btcusd, btcusdt
Charts from TradingView.com
The True Bitcoin Breakout Hasn't Even Happened Yet, Volatility Shows


Credit: Source link


source https://cryptonews.wealthsharingsystems.com/2020/11/the-true-bitcoin-breakout-hasnt-even-happened-yet-volatility-shows/

The True Bitcoin Breakout Hasn’t Even Happened Yet, Volatility Shows

Bitcoin has undergone a massive rally over the past two weeks. From the lows set after the news broke regarding OKEx, the leading cryptocurrency has surged higher by almost 25%. As of this article’s writing, Bitcoin trades for $13,800.

Despite this rapid move to the upside, not all analysts are convinced that the true Bitcoin breakout has taken place. That’s to say, Bitcoin could soon see even more explosive movement.

Related Reading: Here’s Why Ethereum’s DeFi Market May Be Near A Bottom

Bitcoin Hasn’t Even Seen Its True Breakout Yet

A crypto-asset analyst shared the chart below on October 31st, sharing the sentiment that Bitcoin’s volatility is still barely off the lows. The chart below depicts BTC’s one-day historical volatility index since the start of the year. As can be seen, volatility is still far below the highs that were printed during March’s over 60% correction.

This analysis suggests that once Bitcoin breaks the trendline depicted in green, it will begin a move of macro importance. While current trends suggest that will be a move to the upside, BTC could reverse lower from here if another liquidity crisis were to transpire.

Image

Chart of BTC's historical volatility index since the start of 2020 shared by crypto trader and chartist Big Chonis (@Bigchonis on Twitter).
Source: BTCUSD from TradingView.com

Bitazu Capital’s Mohit Sorout thinks that this volatility results in a strong move to the upside. He recently shared the chart below, showing how low Bitcoin’s macro volatility is right now compared to historical levels.

Related Reading: Tyler Winklevoss: A “Tsunami” of Capital Is Coming For Bitcoin

Price Discovery Above $20,000 May Happen

The actual breakout is expected to take Bitcoin above $20,000. Cryptocurrency analyst “Light” recently shared that the leading cryptocurrency could see “price discovery over $20,000” once retail investors re-enter the space.

“The retail segment is not overheated whatsoever currently. It will be soon though. Price is leading public interest. This is a telltale sign of smart money entering while retail has their heads buried in the sand. Once the latter catches up to the former, we’ll be in price discovery over $20,000.”

Tyler Winkelvoss and other investors in the space think Bitcoin will pass $20,000 by the end of 2020. The leading cryptocurrency is currently a 45% rally away from achieving that milestone.

Related Reading: 3 Bitcoin On-Chain Trends Show a Macro Bull Market Is Brewing
Featured Image from Shutterstock
Price tags: xbtusd, btcusd, btcusdt
Charts from TradingView.com
The True Bitcoin Breakout Hasn't Even Happened Yet, Volatility Shows


Credit: Source link


source https://cryptonews.wealthsharingsystems.com/2020/11/the-true-bitcoin-breakout-hasnt-even-happened-yet-volatility-shows/

Uniswap, Aave, Synthetix Continue to Slip Lower in Face of Bitcoin Bump

Top coins in the decentralized finance (DeFi) space such as Uniswap’s UNI and AAVE have slipped lower even as Bitcoin inches higher. Most top DeFi coins have dropped approximately five percent in the past 24 hours as per CoinGecko while Bitcoin has gained over 2%. The leading cryptocurrency briefly traded above the pivotal $14,000 resistance level today but has since dropped due to large sell orders in the $14,000 range.

Related Reading: Here’s Why Ethereum’s DeFi Market May Be Near A Bottom

Strong Fundamentals Contadict Drop in Coins Such Uniswap, Aave, & More

The strong decline in the coins of top DeFi players such as Uniswap, Aave, Synthetix, and Yearn.finance is contradicted by fundamentals. The fundamentals of the decentralized finance space have only strengthened over recent weeks and months, confusing investors in the space.

Head of DTC Capital Spencer Noon noted that while top coins are down by over 60% from their highs, the “most important indicators” of the health of DeFi are pushing new all-time highs:

“Despite a month that saw most tokens fall 50% or more, #DeFi is *still* at ATHs with its most important indicators… Don’t listen to the degens who burned out. Phase 2 of this #DeFi bull market will make this summer look like nothing… And yes, I believe burnout played a major factor in the recent DeFi drawdown. Farmers spent 3 months making serious gains but with barely any sleep. When the market naturally corrected, anecdotally many of my farmer friends decided to hit the sidelines out of sheer exhaustion.””

This was echoed by analysts like Jack Purdy of Messari. On-chain trends show that a large amount of capital continues to enter DeFi contracts to be used in the ecosystem.

Related Reading: Tyler Winklevoss: A “Tsunami” of Capital Is Coming For Bitcoin

More Losses to Come

Despite this, some fear that more losses are to come for this market due to the losses being seen in Uniswap, Aave, Synthetix, and Yearn.finance.

Qiao Wang, a prominent crypto-asset analyst, recently commented on the matter:

“I constantly update my views and unfortunately it looks like there’s going to be more pain in DeFi. Originally I thought we won’t see an 80–90% crash which is typical of alts because of the level of sophistication of DeFi investors but that thesis is being invalidated.”

He explained that due to the weak performances of top DeFi tokens, other assets pertaining to the space will drop by affinity.

Related Reading: 3 Bitcoin On-Chain Trends Show a Macro Bull Market Is Brewing
Featured Image from Shutterstock
Price tags: uniusd, unibtc, unieth, aaveusd, aavebtc, aaveeth, snxusd, snxeth
Charts from TradingView.com
Uniswap, Aave, Synthetix Continue to Slip Lower in Face of Bitcoin Bump


Credit: Source link


source https://cryptonews.wealthsharingsystems.com/2020/11/uniswap-aave-synthetix-continue-to-slip-lower-in-face-of-bitcoin-bump/

Here’s What Could Trigger A Fresh Rally

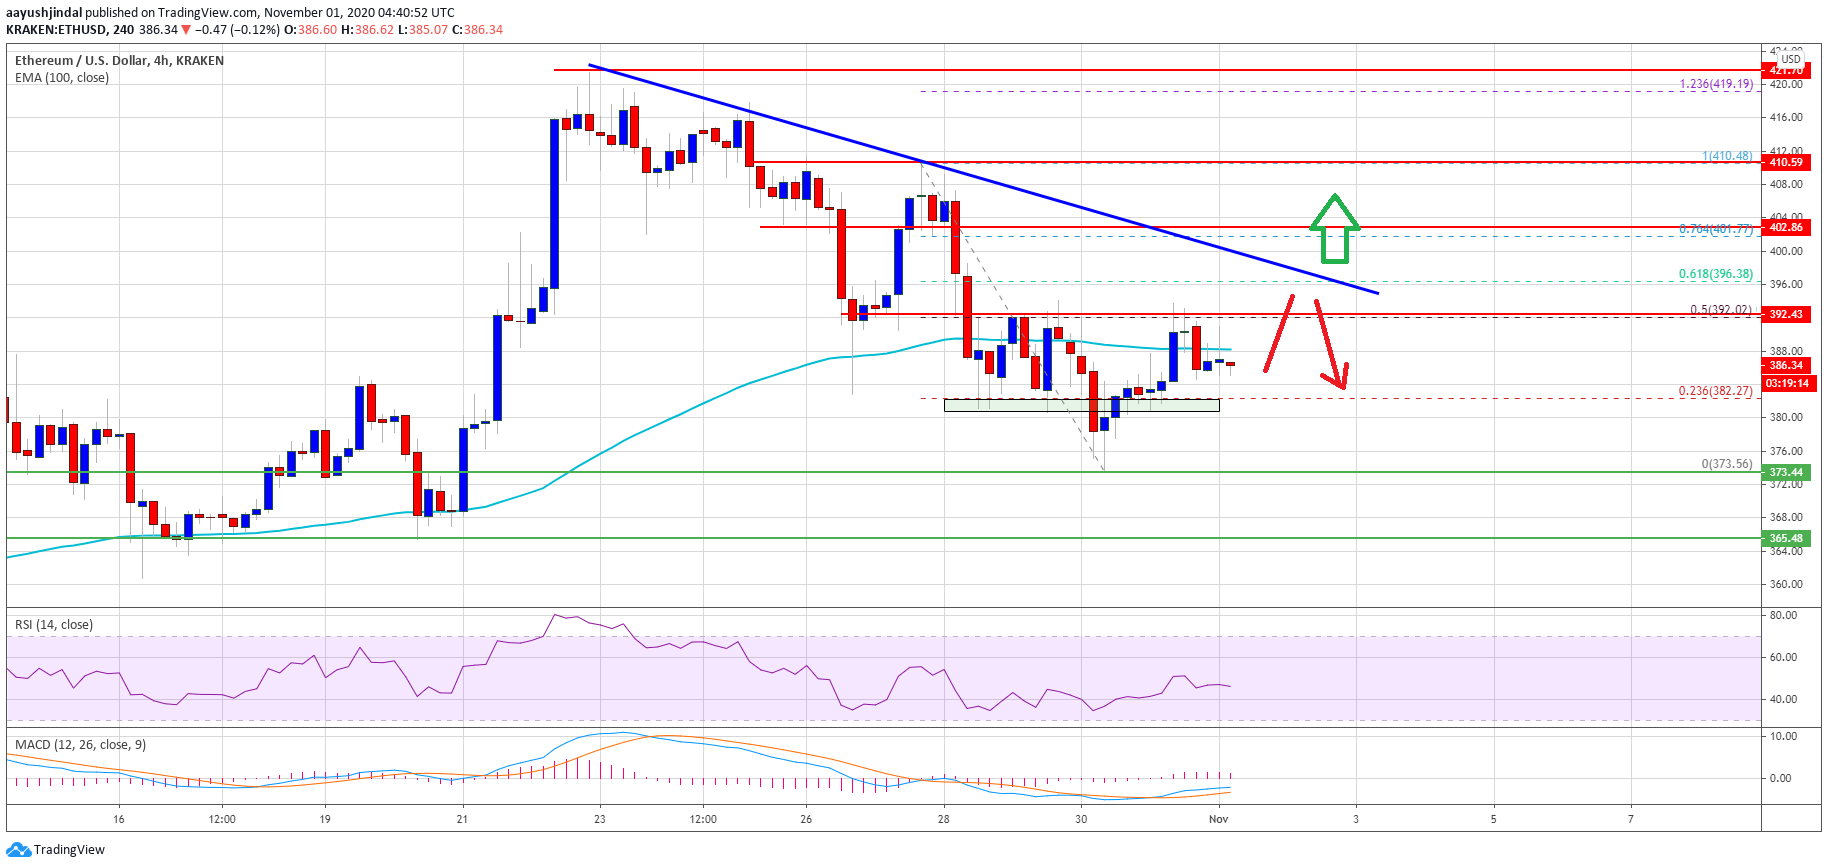
Ethereum struggled to continue higher and declined below $400 against the US Dollar. ETH price is consolidating losses and it must surpass $395 for a fresh rally.

  • ETH price corrected lower below the $400 and $392 support levels against the US Dollar.
  • The price is trading near the $385 zone and the 100 simple moving average (4-hours).
  • There is a major bearish trend line forming with resistance near $395 on the 4-hours chart of ETH/USD (data feed via Kraken).
  • The pair is likely to rally if it clears the $392, $395 and $396 resistance levels.

Ethereum Price is Facing Key Hurdles

This past week, Ethereum started a downside correction from well above $400 against the US Dollar. ETH price even traded below the $392 support level and the 100 simple moving average (4-hours).

A swing low was formed near $373 and ether price started an upside correction after bitcoin’s sharp increase towards $14,000. There was a break above the $380 and $382 levels. The price even climbed above the 23.6% Fib retracement level of the downward move from the $410 high to $373 low.

However, the price seems to be facing a strong resistance near the $392 level. It is close to the 50% Fib retracement level of the downward move from the $410 high to $373 low.

Ethereum Price

Source: ETHUSD on TradingView.com

The next major resistance is near the $395 and $396 levels. There is also a major bearish trend line forming with resistance near $395 on the 4-hours chart of ETH/USD. A successful break above the $392, $395 and $396 resistance levels is must to start a fresh rally in the near term.

The next resistance is near the $400 level, above which the bulls are likely to aim a retest of the $420 resistance zone in the coming sessions.

More Downsides in Ether (ETH)?

If Ethereum fails to clear the $392 and $395 resistance levels, it might start a fresh downside correction. An initial support on the downside is near the $382 level.

The main support is forming near the $373 low. Any further losses could lead the price towards the crucial $365 support (a multi-touch zone).

Technical Indicators

4 hours MACD – The MACD for ETH/USD is struggling to gain momentum in the bullish zone.

4 hours RSI – The RSI for ETH/USD is currently just below the 50 level.

Major Support Level – $382

Major Resistance Level – $395

Credit: Source link


source https://cryptonews.wealthsharingsystems.com/2020/11/heres-what-could-trigger-a-fresh-rally/

Bubble or a drop in the ocean? Putting Bitcoin’s $1 trillion milestone into perspective

On Feb. 19, Bitcoin’s (BTC) market capitalization surpassed $1 trillion for the first time. While this was an exciting moment for investors...