Sunday, 2 August 2020

Bitcoin Just Broke $12,000, As Bulls Take Over Crypto Market

Bitcoin is up over 5% and it surged above the $11,500 resistance zone against the US Dollar. BTC touched the $12,000 market and it seems like the bulls are taking over the crypto market.

  • Bitcoin is gaining bullish momentum and it broke the $11,500 resistance zone.
  • The price even traded above the $11,800 level and settled above the 100 simple moving average (4-hours).
  • There was a break above a crucial contracting triangle with resistance near $11,260 on the 4-hours chart of the BTC/USD pair (data feed from Kraken).
  • The pair is trading in a strong uptrend and it could even surge above $12,200.

Bitcoin Breaks $12,000

In the past few days, there was a strong increase in bitcoin, Ethereum and ripple against the US Dollar. BTC even settled above the $11,200 level and the 100 simple moving average (4-hours).

It opened the doors for more gains and the price recently surged above the $11,500 level. The bulls gained strength and the price rocketed above the $11,800 barrier. It even touched to a new multi-month high at $12,000 and it seems like the price might continue to rise.

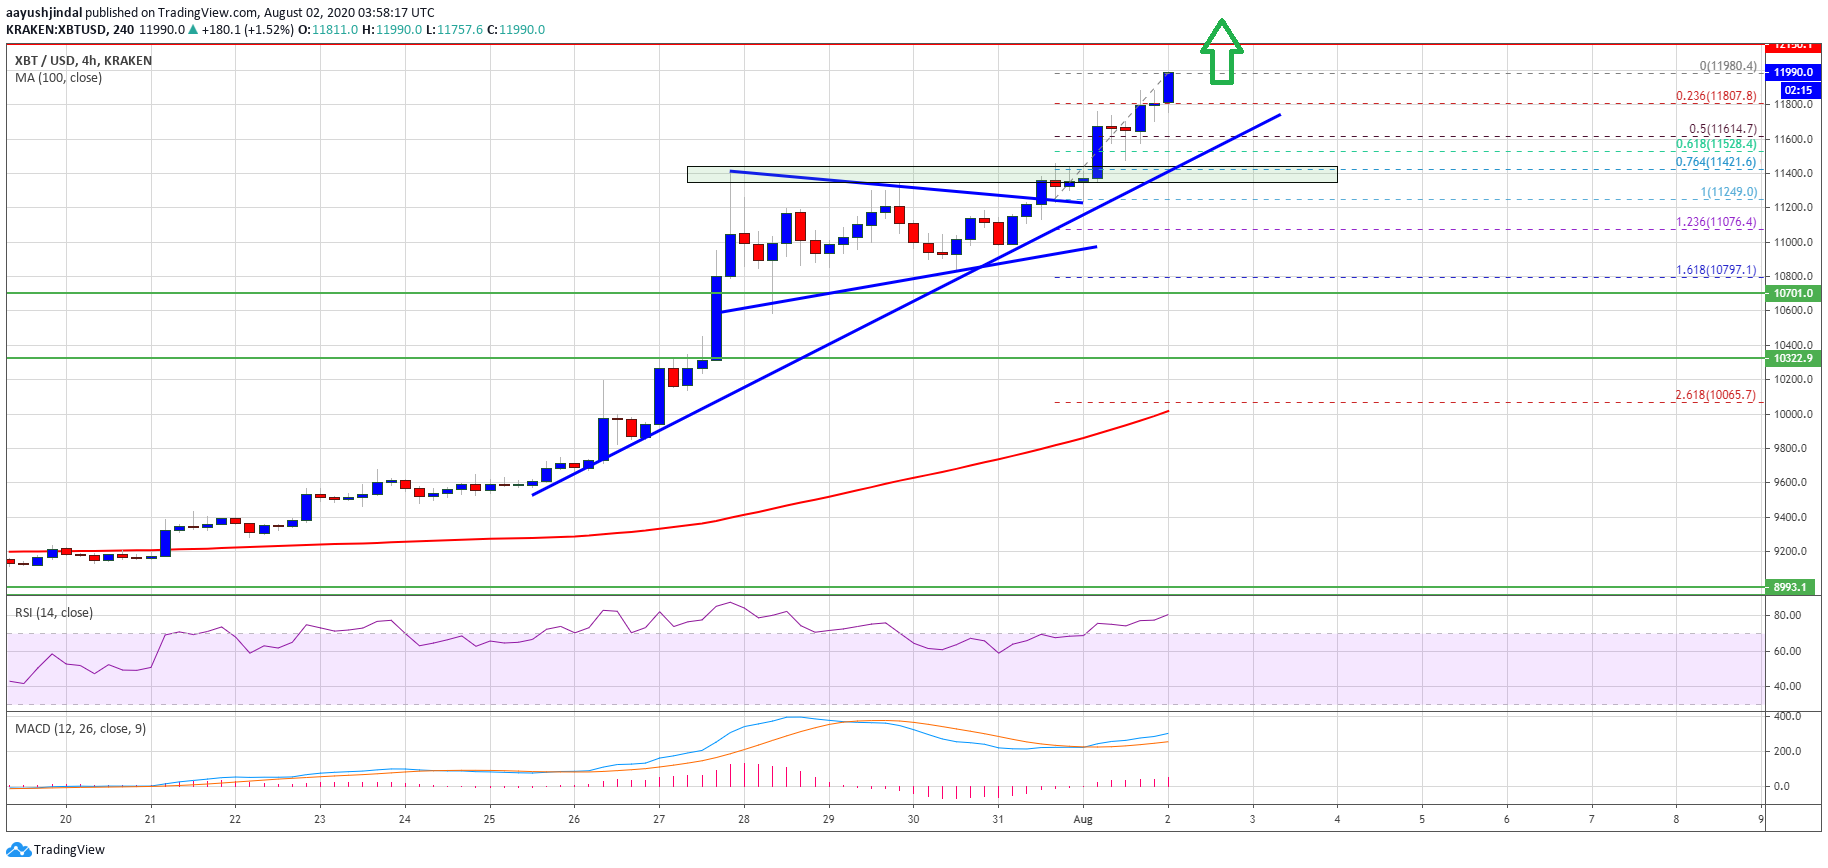
To start the increase, there was a break above a crucial contracting triangle with resistance near $11,260 on the 4-hours chart of the BTC/USD pair. The pair is currently trading in a nice uptrend, with an immediate support near the $11,800 level.
Bitcoin

Bitcoin price breaks $12,000. Source: TradingView.com

The 23.6% Fib retracement level of the recent surge from the $11,249 swing low to $12,000 high is also near the $11,800 zone. The main support is now forming near the $11,600 level and a connecting bullish trend line on the same chart.

On the upside, a successful daily close above the $12,000 level may perhaps open the doors for a sharp increase above the $12,200 and $12,400 levels in the coming sessions. The next major resistance could be $12,800.

Dips Could Be Limited in BTC

If bitcoin starts a downside correction, it is likely to find buyers near $11,800 or $11,600. The 50% Fib retracement level of the recent surge from the $11,249 swing low to $12,000 high is also near $11,614.

A downside break below the $11,600 and $11,500 support levels may perhaps open the doors for a larger decline towards the $11,200 support zone.

Technical indicators

4 hours MACD – The MACD for BTC/USD is gaining strong momentum in the bullish zone.

4 hours RSI (Relative Strength Index) – The RSI for BTC/USD is currently well above the 70 level.

Major Support Level – $11,600

Major Resistance Level – $12,000

Credit: Source link


source https://cryptonews.wealthsharingsystems.com/2020/08/bitcoin-just-broke-12000-as-bulls-take-over-crypto-market/

What Are Analysts Saying After Ethereum Crashed 26% in Under Ten Minutes?


After a nearly unstoppable rally, Bitcoin and Ethereum faced an extreme correction just an hour ago. After moving above $12,000 for the first time in a year, BTC slipped by about $1,500 in five minutes while Ethereum crashed upwards of 26%, per some reports.

Chart of ETH's recent price action from TradingView.com

This extreme move — which was arguably one of the fastest drops in the history of this market — sent ripples throughout the market.

According to one trader, $1 billion worth of Bitcoin and Ethereum futures positions were liquidated in that five minute period. This suggests that buyers were extremely overleveraged on the rally, as they presumably assumed this was a full-blown market.

Analysts are still trying to react to the extreme volatility in the price of Bitcoin and Ethereum. ETH, especially, is under the microscope as it fell as low as $303 on certain platforms, meaning it tumbled just about $112 in the span of an hour.

What’s Next for Ethereum? Analysts Weigh In

Somehow, many analysts remain optimistic about Ethereum despite the vertical drop that the asset experienced.

One trader shared that since Bitcoin held $10,500 and Ethereum held the $360 resistance, they both remain in a technical uptrend. $360 was the level at which Ethereum found a top at the peak of 2019’s rally.

The two cryptocurrencies should close above their respective support levels to confirm that bulls remain in control.

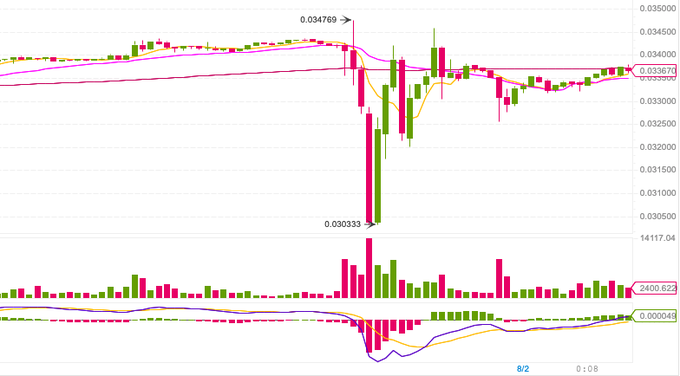
This optimism was echoed by another commentator, who shared this chart below of the ratio between Ethereum and Bitcoin (ETH/BTC). It shows that the extreme plunge that sent ETH to $303 was quickly bought up by bulls, with prices almost returning to pre-crash levels.

Image

Chart of ETH/BTC on Binance by trader "Satoshi Flipper" (@SatoshiFlipper on Twitter). Chart from Binance.

The trader says that this is a sign Ethereum remains in a macro bull market, meaning this drop is but a temporary setback.

One commentator took a more measured approach. He argued that Bitcoin and Ethereum are likely to begin range-trading here as traders, having been reset, assess what comes next:

“I think BTC and ETH just sideways now, that move is probably peak volatility of this or next few weeks. Bidding DeFi alts here because as we sideways, focus will shift again.”

Buoyed By Fundamentals

The fundamentals arguably remain stacked in Ethereum’s favor.

According to DeFiPulse, the value of tokens locked in decentralized finance applications just surmounted $4 billion for the first time ever. This is a metric up by approximately 600% since the start of the year.

Analysts expect the adoption of DeFi to drive demand for ETH and Ethereum-based tokens, driving the prices of these assets higher over time.

Featured Image from Shutterstock
Price tags: ethusd, ethbtc
Charts from TradingView.com
What Are Analysts Saying After Ethereum Dove 26% in Under Ten Minutes?


Credit: Source link


source https://cryptonews.wealthsharingsystems.com/2020/08/what-are-analysts-saying-after-ethereum-crashed-26-in-under-ten-minutes/

Saturday, 1 August 2020

Why Bitcoin’s 3-Day Candle Close Could Lead to a “Parabolic Advance”

Bitcoin is currently expressing intense signs of strength as its price pushes up towards the $12,000 region.

Although it has yet to breach this key level successfully, its strong overnight upswing does seem to indicate that a move higher is imminent in the near-term.

This strength is likely rooted in the bullish monthly close that the benchmark cryptocurrency was able to post yesterday. This was the first time in three years that Bitcoin was able to close its monthly candle above $10,700.

Many analysts are now noting that this may be one of the most positive factors currently working in the cryptocurrency’s favor from a technical perspective.

It also appears that this new development is already bolstering BTC’s mid-term outlook.

One analyst noted that Bitcoin just closed its 3-day candle above the upper boundary of its Bollinger Bands. The last time this happened, its price saw a parabolic rally that sent it surging from $5,000 to highs of $14,000.

Bitcoin Flashes Signs of Strength Following Incredible Monthly Close 

At the time of writing, Bitcoin is trading up just over 2% at its current price of $11,600.

Overnight, bulls were able to push it as high as $11,800 before it reached an insurmountable resistance region.

The selling pressure it faced here slowed its ascent and even catalyzed a slight rejection that led it down towards its current price levels.

That being said, it still remains caught within a firm mid-term uptrend, and slight pullbacks like this one are to be expected.

While zooming out and looking towards its macro price structure, it appears that the gains it has posted throughout the past couple of weeks are significantly bolstering its outlook.

One analyst explained that it is unreasonable to be bearish at the present moment after BTC posted such a strong monthly close.

“BTC HTF Update: Imagine being bearish, strongest monthly in 3 years,” he explained while pointing to the below chart.

Bitcoin

Image Courtesy of Cactus. Chart via TradingView.

BTC Could Be Gearing Up for a Parabolic Push Higher

Another popular cryptocurrency analyst explained that Bitcoin’s three-day candle just closed above the upper boundary of its Bollinger Bands.

The last time it closed above this technical level, the cryptocurrency rallied from $5,000 to highs of $14,000.

“Bitcoin 3 day candle just closed, and the entire range was transacted above the upper BB – the last time that happened was April 4th 2019, right around $5000 before we made that run to $14000,” he said.

Image Courtesy of Cheds. Chart via TradingView.

The confluence of this technical development, coupled with Bitcoin’s strong monthly close, seems to suggest that BTC could be well-positioned to post notable gains during the second half of the year.

Featured image from Unsplash.
Charts from TradingView.


Credit: Source link


source https://cryptonews.wealthsharingsystems.com/2020/08/why-bitcoins-3-day-candle-close-could-lead-to-a-parabolic-advance/

Dramatic $17,000 Bitcoin Peak Possible Within Weeks Based on Halving Fracal

If a fractal plays out on Bitcoin price charts matching the previous halving post-consolidation breakout, the cryptocurrency could keep on climbing from here.

The target, if the rally takes a similar path, would put valuations of the top cryptocurrency at between $15,000 to $17,000 before peaking.

Bitcoin Breaks Out: What Happens Next Will Be Fast and Furious

Bitcoin price exploded early last week on the heels of gold setting a new record and the government committing to another $1 trillion in stimulus spending.

Inflating money supply has prompted a flight to hard assets like precious metals and cryptocurrency. Digital gold and its physical counterpart have both benefited from the recent weakness in the dollar.

Bitcoin earns its comparison to the precious metal due to several key similarities. For instance, gold has a finite supply and the cryptocurrency is digitally coded so only 21 million BTC will ever exist.

Related Reading | Bitcoin Just Broke Past $11,500—and That’s Huge For Bulls

This supply is slowly tricked out over the course of years. Every four years give or take, the amount of BTC that is released freely into the market is then slashed in half in an event called the halving.

Several supply based theories exist that attempt to give a future valuation to the asset based on scarcity. Those who follow this belief expect a repeat of past cycles and the asset to grow in value how that the most recent event has passed.

But will things really play out the same way? One pseudonymous trader has discovered a potential fractal playing out that points to a peak much higher above current levels. And it may happen a lot faster than anyone is prepared for.

bitcoin chart btcusd

BTCUSD 2016 Post-Halving Fractal | Source: TradingView

Post-Halving Fractal Targets Between $15,000 and $17,000 BTC in Less Than a Month


Analysts often look at past Bitcoin cycles to gain perspective into future price action. One trader has done just that and come up with a compelling fractal from the last block reward halving. This took place in 2016 and sent Bitcoin off on its biggest bull run ever.

The same could be happening again right now, according to technical analysis and fundamental data.

bitcoin chart btcusd

BTCUSD 2020 Post-Halving Fractal | Source: TradingView

According to the fractal, this pump may only just be getting underway, with a proposed target of between $15,000 and $17,000 target. What’s really shocking, is the timing of the target.

Related Reading | Silver Fractal: Are Crypto Altcoins On the Cusp of an Explosive Surge?

The fractal suggests a rapid and impulsive burst to this level within the next few weeks, and before August has come to a close.

bitcoin chart btcusd

Bitcoin Supply Percent Active 2+ Years | Source: glassnode

Further fundamental data suggests that the cryptocurrency is at a similar point in its market cycle. If this is the case, and the asset’s valuations rising are driven by the halving effect and digital scarcity, things may take a similar path.

Fractals are a touchy subject amongst traders, so take the targets with a grain of salt.


Credit: Source link


source https://cryptonews.wealthsharingsystems.com/2020/08/dramatic-17000-bitcoin-peak-possible-within-weeks-based-on-halving-fracal/

Bitcoin Just Printed a Textbook Reversal Signal After Surging to $11,800

Bitcoin has seen another explosive move in the past 24 hours. As of the time of this article’s writing, the leading cryptocurrency has pressed higher to $11,800 for the first time in approximately a year.

This means that on the week, BTC has gained around 20%. And in the past day alone, Bitcoin has gained 4% — the best one-day performance since the rally from the $10,000s to $11,500 on Monday.

Bitcoin’s latest leg higher has been marked by an influx of liquidations of cryptocurrency margin platforms. According to Skew.com, a crypto derivatives portal, more than $5.3 million worth of BitMEX shorts have been liquidated in the past alone. This adds to the dozens of millions more that have been liquidated in the past 72 hours as BTC has shot higher.

Although some expect BTC to crack $12,000 in the hours ahead, an analyst has noted that Bitcoin has formed a textbook bear signal. But that’s not to say that it will undergo a correction.

Bitcoin Forms Textbook Reversal Signal

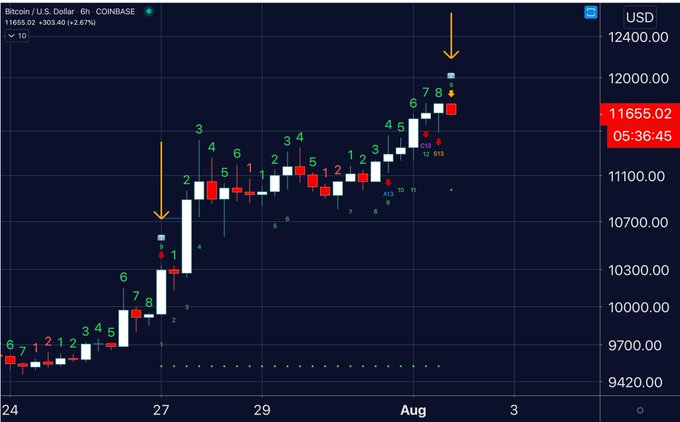
Bitcoin’s price action over the past day has been impressive but some technical indicators suggest that traders should still be cautious. One cryptocurrency trader shared the chart below minutes after BTC hit $11,800, writing:

“Double 9’s on the 6hr #bitcoin still early in the candle, could set up as perfected on the close.”

The trader is referencing how the Tom Demark Sequential (TD Sequential), a technical indicator that predicts inflection points in the trend of an asset, printed a potential reversal candle at the recent highs.

The TD Sequential forms “9” or “13” candles when an asset is likely at an inflection point. In the case of Bitcoin, as per the chart below, a correction is expected.

Image

Chart of BTC's price action with TD Sequential overlay by trader "Big Chonis" (@BigChonis on Twitter). Chart from TradingView.com

While the TD Sequential is printing a signal of a potential reversal, the last time it formed a “9” on the six-hour chart, BTC only corrected for one candle, falling around 1.5%. As can be seen in the chart above, this happened on July 27th.

This historical precedent may suggest that BTC bulls may ignore the potential reversal signal.

Related Reading: Crypto Tidbits: Ethereum Surges 20%, US Banks Can Hold BTC, DeFi Still in Vogue

Most Indicators Remain Bullish

Corroborating the expectation that Bitcoin will ignore the TD Sequential “9,” other indicators and analysts remain optimistic about BTC’s short-term prospects.

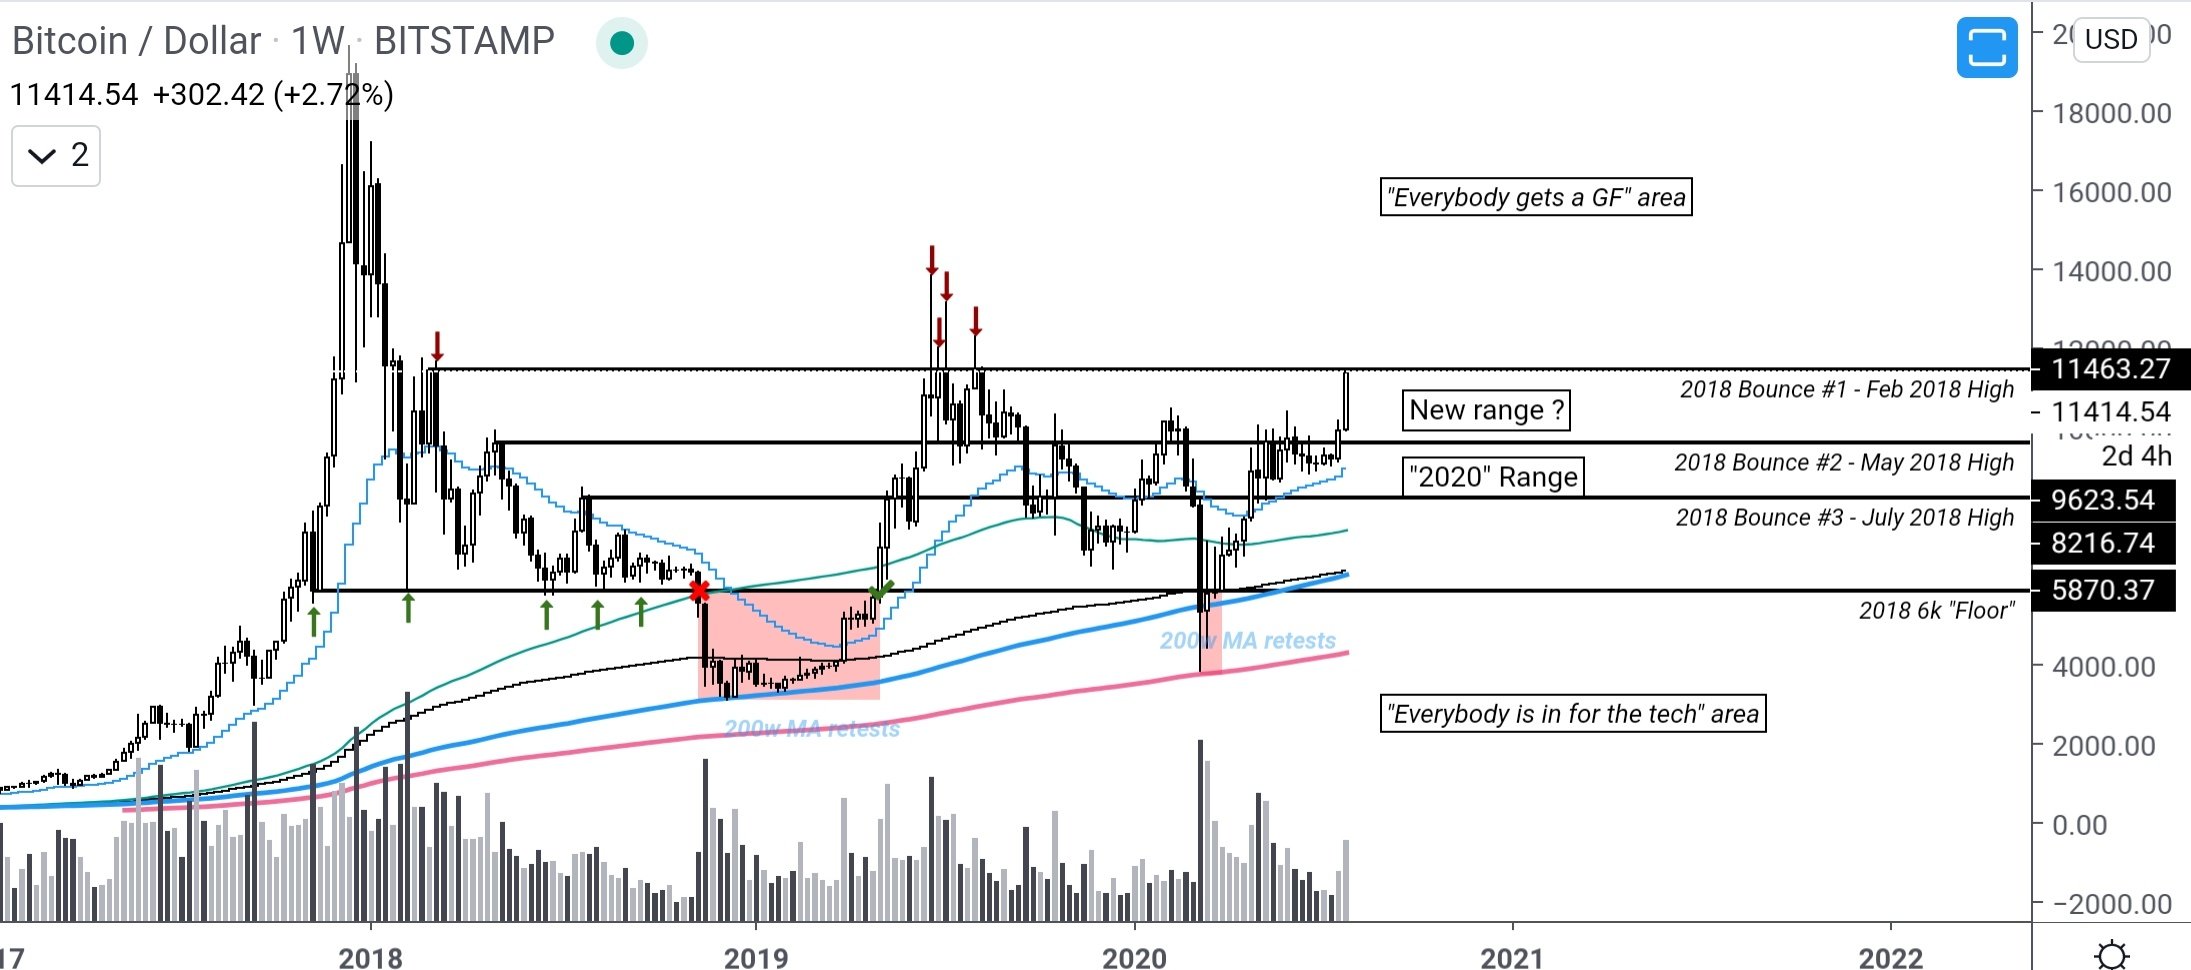
One trader commented that as long as Bitcoin holds above $11,500, the asset is primed to see further gains in the weeks ahead:

“Few hours to go before a massive monthly close. Few days to go to close the weekly above 11.5k.I personally wouldn’t have any problems with the Ear of maize hovering between 10k and 11.5k if that’s what needed for sustainable growth to ATH.”

Image

Chart of BTC's macro price action from trader Pierre (@Pierre_crypt0 on Twitter). Chart from Tradingview.com

With funding rates still relatively low as well, BTC seems primed to continue its move to the upside.

FEatured Image from Shutterstock
Charts from TradingView.com
Price tags: xbtusd, btcusd, btcusdt
BTC Just Printed a Textbook Reversal Signal After Surging to $11,800


Credit: Source link


source https://cryptonews.wealthsharingsystems.com/2020/08/bitcoin-just-printed-a-textbook-reversal-signal-after-surging-to-11800/

Nevada Regulators Seek Fines for Face Mask Issues


The Nevada Gaming Control Board recently investigated complaints against casinos over health and safety concerns, specifically in regard to face mask issues. Now, they have released the specific violations and the names and properties.

The complaints in each case allege that during repeat visits held several days apart, state inspectors saw employees and patrons without face coverings or wearing them improperly. Records showed that complaints were filed since last Friday against C.O.D. Casino in Minden.

The Hotel Nevada & Gambling Hall in Ely was also caught violating state mandates. A regulator noted that casino employees approached customers while an agent was taking photos and appeared to tell them to don face coverings, and that bar-top slot machines were on and available for play, the complaint said.

No word yet on what the punishment could be for these properties, but the Control Board want’s fines issued. You can read more on these face mask issues at Yogo Net.


Tagged Control Board, face mask issues, las vegas, Nevada casino

Credit: Source link


source https://cryptonews.wealthsharingsystems.com/2020/08/nevada-regulators-seek-fines-for-face-mask-issues/

WPT GTO Trainer Hands of the Week: Final Table Play in Big Blind Vs The Chip Leader

This week we’re playing a common final table tournament spot where we are defending the Big Blind as a medium stack against the chip leader at the table. Due to the presence of final table pay jumps and 2 shorter stacks, there is significant ICM pressure on us in this spot. We are highly incentivized to avoid getting stacked while the 2 shorter stacks are still alive at this final table.

The chip leader on the Button can open raise preflop with a much wider range than normal because of this pressure we are facing. Our defense range in the Big Blind is narrower than it would be if there were no pay jump considerations. This final table spot changes not just our preflop ranges, but our post flop play as well.

Like most Big Blind defense scenarios, we typically start by checking to the raiser. Our play will often continue to be passive against the chip leader in many spots in an attempt to play smaller pots.

With weaker draws such as gutshots, we can often call a small c-bet on the flop. Even though we are typically playing passively against the chip leader, we can still bluff some of the time when our draws miss and our opponent’s range isn’t strong. This is especially true if we hold blockers to a big hand.

With big made hands, we should often still take a bluff-catching passive line against our opponent. This provides cover to our weaker hands, but also allows our opponent to bluff into our strong hands. When facing very aggressive opponents attempting to exert maximum ICM pressure, taking passive lines with your strong hands is often the most profitable strategy.

When facing large c-bets from your opponent, don’t be afraid to fold some hands you would continue with against a smaller bet, such as gutshots with overcards. You will occasionally check-raise bluff against the bigger sizing when you hold blockers to strong hands.

To see more examples and test your skills, you can play through five free solved hands from this scenario.

Regular play on the WPT GTO Trainer will help you adjust your decisions closer and closer to GTO strategy.

You don’t have to be the world’s best player to use GTO Strategy, and thanks to the WPT GTO Trainer, now you don’t have to buy expensive software or have expert level knowledge to study GTO.

Why use the WPT GTO Trainer?

The WPT GTO Trainer lets you play real solved hands against a perfect opponent in a wide variety of postflop scenarios for cash game and tournament play.

If your goal is to be a tough poker player then you should try the WPT GTO Trainer today.

Register a free account here (it only takes your e-mail address to begin) to play hands and see true GTO strategy in real-time.

The WPT GTO Trainer has over 1 billion unique solved flops, turns and rivers that are fully playable.

As you make decisions in a hand, you receive instant feedback on the specific EV loss (if any) and Played Percentage for every action you take as compared to GTO strategy.

The full selection of scenarios for the WPT GTO Trainer are only available to members of LearnWPT, however we’re giving PokerNews Readers free access to the Trainer on a regular basis with the WPT GTO Hands of The Week.

Use this series of articles to practice the strategies you learn on LearnWPT (or at the table) and test your progress by playing a five-hand sample each week.

Credit: Source link


source https://cryptonews.wealthsharingsystems.com/2020/08/wpt-gto-trainer-hands-of-the-week-final-table-play-in-big-blind-vs-the-chip-leader/

Bubble or a drop in the ocean? Putting Bitcoin’s $1 trillion milestone into perspective

On Feb. 19, Bitcoin’s (BTC) market capitalization surpassed $1 trillion for the first time. While this was an exciting moment for investors...