Decentralized finance, or DeFi, has become one of the year’s most remarkable growth stories. As millions of users converge on this new paradigm-shifting technology, questions surrounding the legitimacy and accountability of DeFi platforms are becoming more critical. Although there are hundreds of companies in the DeFi sector, only one is backed by an SEC-regulated, publicly listed enterprise—xSigma Corporation.
Founded in 2018 as a blockchain research and development lab, xSigma is a subsidiary of ZK International Group (NASDAQ: ZKIN), a multinational manufacturing and technology company with a presence in Asia, Europe and North America. Through the support of its parent company, xSigma is building a decentralized marketplace that will allow for the proliferation of affordable financial services, payment solutions and custody.
XSigma’s public backing and world-class development team bring a new level of transparency, accountability and legitimacy to the DeFi sector. Through ZK International, xSigma can bridge the gap between the booming crypto vertical and the functionality of more established trade-fi platforms. The result is a solution that combines the best of both worlds: the trustless design of DeFi coupled with the functionality of traditional finance.
To aid xSigma’s development, ZK International recently announced a partnership with Dentoro Alliance LP, a major European software company that will provide key development and operational resources to the DeFi subsidiary. The Dentoro agreement adds to xSigma’s in-house capacity and reputational strength, ensuring a smooth project rollout over the next several years. XSigma currently employs an award-winning team of software developers, project managers and engineers formerly of Google, Facebook, Amazon, Ripple Labs, 1inch and others.
ZK International provides xSigma the human and capital resources required to address the myriad issues currently undermining DeFi adoption, especially among more traditional mainstream investors. XSigma’s forthcoming decentralized exchange will offer a user-friendly platform for token swapping, farming, governance and account management. Further down the road, these functionalities will be enhanced with new lending and borrowing services, a regulated custodial exchange and a derivatives platform for blockchain assets. XSigma’s enhanced user experience will replace the faulty UI, stuck transactions, pricing error and pooling issues that currently plague DeFi projects.
The DeFi solutions that prevail in the long run will combine outstanding technology with a team, vision and backers of equal caliber. Through ZK International, XSigma is in a position to lead the nascent DeFi industry and onboard a new generation of users.
Get the latest updates on xsigma DeFi by visiting ZK International and following us on social media.
Most investors that follow Bitcoin will have recently heard about the growing impact Bitcoin (BTC) futures and options markets have on Bitcoin price. The same can be said for the price swings caused by liquidations at OKEx and Huobi exchanges.
Considering that derivatives markets are now playing a much bigger role in Bitcoin price fluctuations, it is becoming increasingly necessary to review some of the key metrics professional traders use to gauge activity in the markets.
While reviewing futures and options contracts can be quite complicated, the average retail trader can still benefit from knowing how to properly interpret the futures premium, funding rate, options skew and put-call ratio.
Futures remium
The futures premium measures how expensive longer-term futures contracts are to the current spot at traditional markets. It can be thought of as a relative reflection of investor optimism, and fixed-calendar futures tend to trade at a slight premium to regular spot exchanges.
The 2-month futures should trade with a 0.8% to 2.3% premium in healthy markets, and any number above this range denotes extreme optimism. Meanwhile, the lack of a futures premium indicates bearishness.
BTC 2-month future contracts premium. Source: Digital Assets Data
The past week was a roller coaster and the indicator reached 2% on Nov. 24 while Bitcoin price peaked at $19,434.
Even though the premium currently sits at 1.1%, what is more significant is that despite a 14% price drop, the indicator held above 0.8%. Generally, investors view this level as bullish, and today we can see that Bitcoin price secured a new high above $19,900.
Perpetual futures funding rate
Perpetual contracts, also known as inverse swaps, have an embedded rate usually charged every eight hours. Funding rates ensure there are no exchange risk imbalances. Even though both buyers and sellers open interest is matched at all times, leverage can vary.
When buyers (longs) are the ones demanding more leverage, the funding rate goes positive. Therefore, those buyers will be the ones paying up the fees. This issue holds especially true under bull run periods, when usually there’s more demand for longs.
Sustainable rates above 2% per week translate to extreme optimism. This level is acceptable during market rallies but problematic if BTC price is sideways or in a downtrend.
In situations like these, high leverage from buyers presents the potential of large liquidations during surprise price drops.
BTC perpetual futures funding rates. Source: Digital Assets Data
Take notice how, despite the recent bull run, the weekly funding rate has managed to remain below 2%. This data indicates that although traders feel optimistic, buyers were not overleveraged. Similarly, during the $1,400 price drop on Nov. 26, the indicator held a healthy neutral level.
Options skew
Unlike futures contracts, options are divided into two segments. Call (buy) options allow the buyer to acquire BTC at a fixed price on the expiry date. On the other hand, the seller of the instrument will be obliged to make the BTC sale.
The 25% delta skew compares side-by-side equivalent call (buy) and put (sell) options. If the protection for price upswings using call options is more costlier, the skew indicator shifts to the negative range. The opposite holds when investors are bearish, causing put options to trade at a premium, causing skew indicators to shift positively.
Oscillations between -15% (slightly bullish) to +15% (somewhat bearish) are typical and expected. It’s very unusual for any market to remain flat or near zero most of the time.
Thus, traders should monitor more extreme situations as they may indicate that market makers are unwilling to take risks on either side.
The above chart shows that since Nov. 5, option traders are unwilling to take positions exposing themselves against an upside. Therefore, traders will deem this a very bullish situation.
Options put-call ratio
By measuring whether more activity is going through call (buy) options or put (sell) options, one can gauge the overall market sentiment. Generally speaking, call options are used for bullish strategies, whereas put options for bearish ones.
A 0.70 put-to-call ratio indicates that put options open interest lag the more bullish calls by 30% and is therefore bullish.
In contrast, a 1.20 indicator favors put options by 20%, which can be deemed bearish. One thing to note is that the indicator aggregates the entire BTC options market, including all calendar months.
BTC options put-to-call ratio. Source: Skew.com
In situations such as the one currently seen in the market, it’s only natural for investors to seek downside protection as BTC surpasses $19,000 even though the put/call ratio has been way below its 6-month average of 0.90. The current 0.64 level shows that there is a lack of pessimism from professional traders.
Overall these four key indicators have held steady, especially considering the market just suffered a somewhat traumatic pullback as BTC price dropped to retest $16,200.
With the price back above $19,500 again, nearly every investor wants to know if Bitcoin has enough strength to break its all-time high this week.
From a derivatives trading perspective, nothing is holding it back.
The views and opinions expressed here are solely those of theauthorand do not necessarily reflect the views of Cointelegraph. Every investment and trading move involves risk. You should conduct your own research when making a decision.
Bitcoin price is up over 5% and it is trading above the $19,500 level against the US Dollar. BTC bulls seem to be aiming a new all-time high above the $20,000 resistance.
Bitcoin is rising steadily and it broke a major hurdle at $19,500.
The price traded as high as $19,860 and it is now well above the 100 hourly simple moving average.
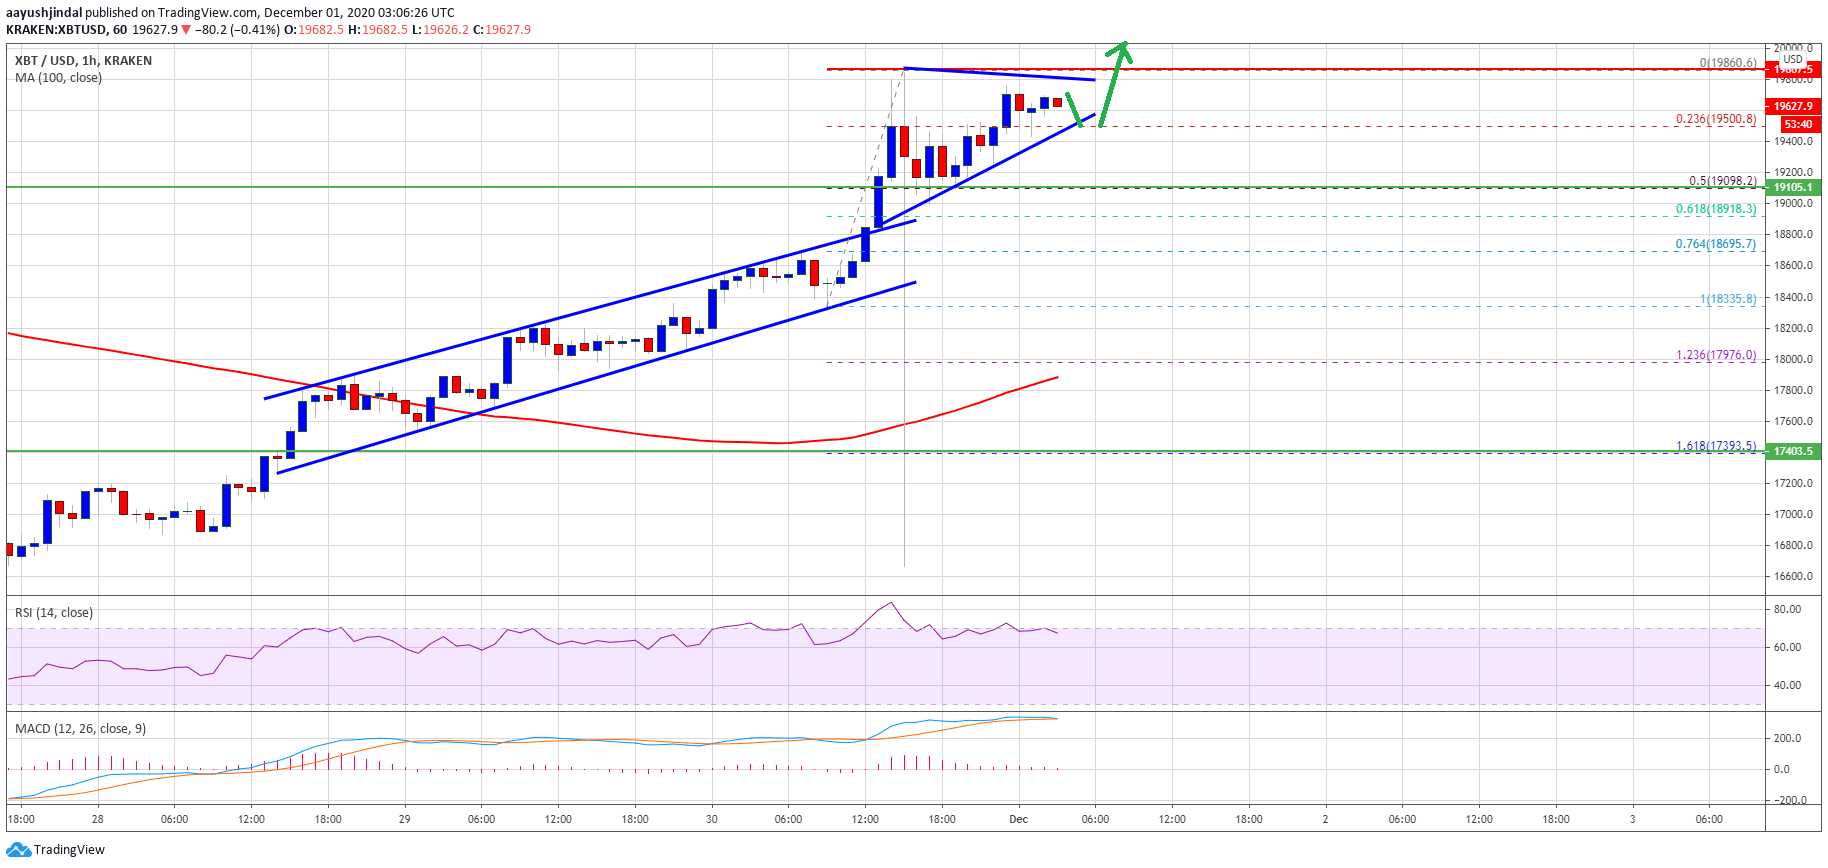
There is a key contracting triangle forming with resistance near $19,800 on the hourly chart of the BTC/USD pair (data feed from Kraken).
The pair could start a strong surge once it clears the $19,800 and $19,850 levels.
Bitcoin Price is Approaching $20K
Yesterday, we saw the start of a decent increase in bitcoin price above the $18,500 resistance. BTC remained in a positive zone and cleared the $19,000 resistance.
The price even climbed above the $19,500 resistance and traded to a new 2020. Bitcoin price traded as high as $19,860 and it is now well above the 100 hourly simple moving average. There was a minor downside correction recently below the 23.6% Fib retracement level of the recent wave from the $18,335 swing low to $19,860 high.
There was a spike below the $19,200 level, but dips were limited. The 50% Fib retracement level of the recent wave from the $18,335 swing low to $19,860 high acted as a strong support.
Source: BTCUSD on TradingView.com
Bitcoin formed a support base near $19,200 and it is currently trading above $19,500. There is also a key contracting triangle forming with resistance near $19,800 on the hourly chart of the BTC/USD pair.
If there is a clear break above the triangle resistance and $19,860, the price could start a strong surge in the coming sessions. In the stated case, the bulls might aim a new all-time high above the $20,000 level.
Downside Correction in BTC?
If bitcoin fails to clear the triangle resistance at $19,800, there could be a short-term downside correction. An initial support on the downside is near the triangle lower trend line at $19,550.
A clear break below the triangle support might start an extended decline towards $19,200. The next major support below the $19,200 level is near the $18,800 level (a multi-touch zone).
Technical indicators:
Hourly MACD – The MACD is slowly losing momentum in the bullish zone.
Hourly RSI (Relative Strength Index) – The RSI for BTC/USD is currently correcting lower from the 70 level.
Major Support Levels – $19,550, followed by $19,200.
Major Resistance Levels – $19,800, $19,860 and $20,000.
Bitcoin price just set a new all-time high today, and then immediately dropped $500 and is trading below the former peak once again. Murmurs of a “double top” scenario have been making rounds across the speculation-driven crypto community.
However, one well-known crypto trader and analyst explains why such a scenario is nearly impossible, due to the requirements involved in confirming the technical chart pattern.
Bitcoin Sets New All-Time High, Drops $800 Immediately After
Bitcoin price set a new all-time high of $19,863 on Binance and beat the former peak on other spot crypto exchanges like Coinbase and Bitstamp, certifying the historic moment.
Within minutes of the achievement, however, the leading cryptocurrency by market cap plunged by $800 and is back holding onto $19,000 as support.
The rejection here after a new peak was set, and even before as Bitcoin has previously stopped short of a new high, sparked discussion and wild speculation over a possible “double top” scenario.
Related Reading | Bitcoin Rally Isn’t Just Institutional Driven, Emerging Markets Are Voting For Revolution
Double tops occur when an asset peaks at or around the same resistance level at the height of two rallies. The resistance that is created, can often be unbreakable and causes a complete reversal – hence being called a “top.”
But like any chart patterns, they must meet certain requirements to “confirm” as “valid,” and according to one well-known crypto trader, the scenario is just nonsense.
A Bitcoin double top requires bottom support to break down | Source: BTCUSD on TradingView.com
Crypto Trader Breaks Down Why BTC Won’t Double Top
Melker explains that the requirements to confirm such a pattern as valid would require a break of the swing low between each of the two tops.
The swing low being Bitcoin’s bottom at $3,200. If Black Thursday couldn’t break it, most likely nothing will, and it becomes even more unlikely with the cryptocurrency so close to breaking out into a bull market.
Additionally, Melker outlines that the target of such a structure would be roughly -$16,000 – as in a negative price per BTC.
Unlike oil that requires a hefty cost to store, Bitcoin prices would not fall into negative territory. Zero is of course possible but is at this point less feasible than $100,000 per coin.
Bitcoin topping here isn’t all that bad, either. The first-ever crypto-asset could be forming a massive ascending triangle formation – a bullish technical continuation pattern.
An ascending triangle could be forming as Bitcoin is ahead of schedule | Source: BTCUSD on TradingView.com
According to a comparison with the last crypto market cycle, Bitcoin is currently far ahead of schedule in terms of setting a new all-time high. With Bitcoin halving theories based on a four-year block reward reduction mechanism, market cycles are expected to follow a somewhat similar trajectory.
Related Reading | Here’s What Will Happen To Altcoins Once Bitcoin Breaks $20,000
This could imply that either there will another stretch of consolidation around current prices for the next three to six months, or that the macroeconomic environment due to the pandemic and out-of-control money printing, could be having that dramatic of an impact.
If that’s the case, being concerned with a “top” around $20,000 could be as foolish as Melker makes it out to be, as the cryptocurrency’s momentum will take it much higher before the next peak is in.
Featured image from Deposit Photos, Charts from TradingView.com
XRP has surged 10% higher in the past 24 hours as Bitcoin has begun to consolidate in the mid-$19,000s. The crypto market saw a strong surge higher seemingly as a result of new institutional inflows, which were previously absent as a result of the Thanksgiving holiday weekend.
BTC is up around 6% in the past 24 hours, having pushed to $19,500. The coin traded as high as $19,900 on some top exchanges, though there is some mispricing as a result of some discrepancies between futures and spot markets.
XRP is expected to move higher in the days ahead if Bitcoin continues its ascent. There are some divided over BTC’s short-term prospects, though, as the coin faces extremely high funding rates on top futures platforms.
Related Reading: Here’s Why Ethereum’s DeFi Market May Be Near A Bottom
The XRP Outlook
Analysts are bullish on XRP as the coin manages to consolidate despite an extremely strong rally last week. XRP has begun to hold a key resistance level on a short-term basis, which an analyst says may precede a further rally to the upside.
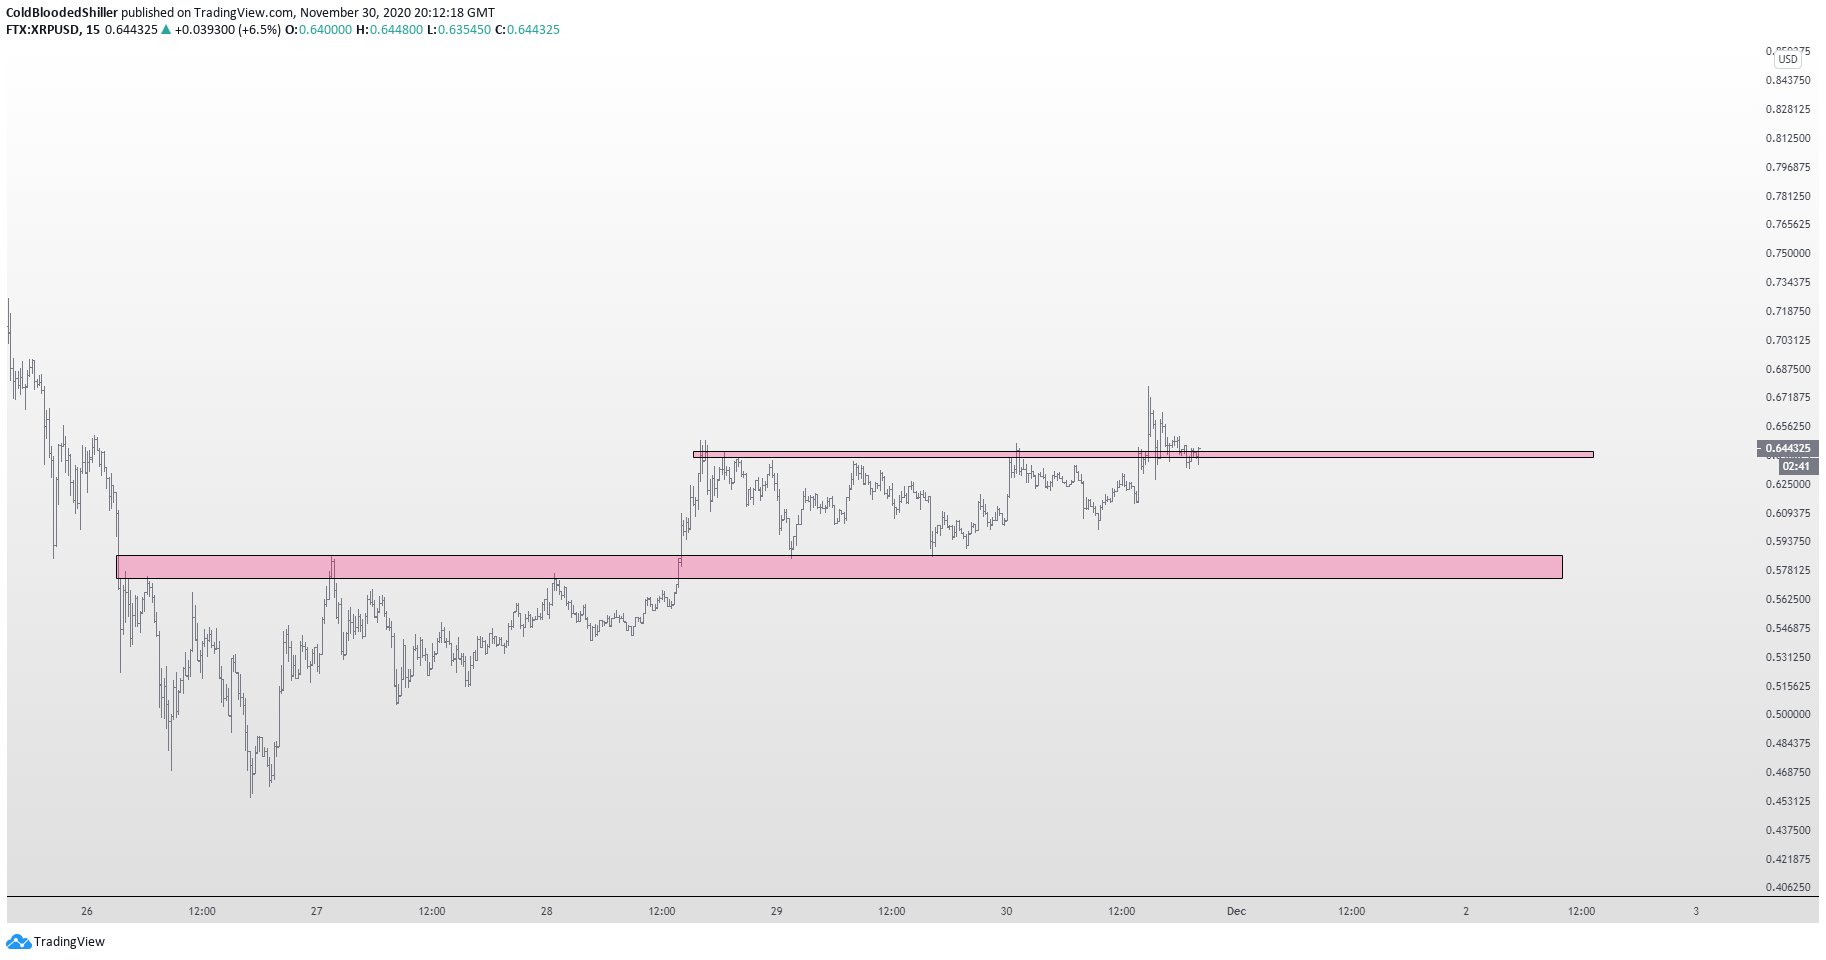
The chart below shows this trend playing out. As can be seen, XRP is in the midst of consolidating above a crucial technical level in the near term.
Per the chart, there may not be much resistance until prices far above the current range.
Chart of XRP's price action over the past week with an analysis by crypto trader Cold Blooded Shiller (@ColdBloodShill on Twitter).
Source: XRPUSD from TradingView.com
Related Reading: Tyler Winklevoss: A “Tsunami” of Capital Is Coming For Bitcoin
How Does Bitcoin Look?
XRP’s performance is somewhat predicated on that of Bitcoin.
Analysts are mixed as Bitcoin has stalled under $20,000, though the fundamentals of the coin remain bullish. This should provide XRP with a boost moving forward.
Commenting on the drop last week, Willy Woo, a prominent on-chain analyst and technical analyst, said:
“Margin longs will be spanked until they go short. Was bullishness was way overheated. Exchange flows are neutral; spot sellers are matched with buyers. Fundamentals a great. The next few weeks? A great time to scoop cheap coins for 2021.”
Analysts are also confident that institutional buying pressure will send Bitcoin skyrocketing soon enough.
Related Reading: 3 Bitcoin On-Chain Trends Show a Macro Bull Market Is Brewing
Featured Image from Shutterstock
Price tags: xbtusd, btcusd, btcusdt
Charts from TradingView.com
XRP Continues Ascent With 10% Surge as Bitcoin Consolidates
The price of Bitcoin (BTC) reached $19,873 on Coinbase on Nov. 30, breaking above $19,000 in a surprising recovery rally. Although many in the cryptocurrency sector a celebrating BTC achieving an all-time high, it has not just yet.
On Coinbase, the price of Bitcoin hit its peak at $19,891 in December 2017. The all-time high price on Coinbase is particularly important because it has consistently remained as the top U.S. exchange for the past several years.
BTC/USD monthly chart at Coinbase. Source: TradingView
Also, some top global exchanges like Binance launched in mid-2017. An argument could be made that an exchange that has been around since 2012 carries more significance in terms of historical price data and to date, Coinbase remains one of the primary exchanges used by retail investors.
Bitcoin’s all-time highs vary across exchanges
2017 was a tumultuous period for cryptocurrencies. By the time Bitcoin achieved a new all-time high, it saw 30% to 50% price swings in a week as the cryptocurrency exchange market showed a lack of liquidity.
Currently, the record highs differ by nearly $300 between exchanges. For instance, on Kraken and Bitstamp, BTC peaked at $19,660 and $19,666, respectively. Today, BTC price hit a new all-time high at both exchanges.
On Binance and Huobi, BTC reached a top at $19,799 and $19,867, both of which were also achieved on Nov. 30.
At the time of writing, Bitcoin is yet to see a new record high on Bitfinex, Coinbase, and Gemini, which are also coincidentally known as the exchange for whales due to their high liquidity.
In 2017 Coinbase was a leading exchange in terms of trading volume, and in the minds of many traders, seeing the price surpass its previous all-time high would provide further confirmation that a bull market has officially started.
For many traders, $20,000 is the barrier that needs to be broken as it will officially concretize a new all-time high for the top-ranked digital asset.
A pseudonymous trader known as “Bitcoin Jack” pinpointed Bitfinex as the most liquid exchange during this ongoing rally. Hence, considering that Gemini and Coinbase’s record highs are near Bitfinex, the $19,873 level makes an accurate all-time high. He said:
“Careful out there as liquidity to open interest ratios took a hit across most exchanges. It means that, until liquidity gets replenished, the amount of liquidity vs OI is relatively low allowing for less contained cascades to both sides As always, Finex is the liquidity king.”
What’s next for Bitcoin price?
On-chain analysts, including CryptoQuant CEO Ki Young Ju, predicted that whales would try front-run the all-time high and apply significant selling pressure.
As Bitcoin neared its record high on Coinbase, a sudden sell-off occurred, taking BTC to as low as $18,998 within two hours.
Following the heightened level of volatility and a whale-induced sell-off, the futures market’s open interest took a hit, and exchange order books have been hindered.
There are two scenarios in the near term that Bitcoin could see after its first attempt to break out of its all-time high.
First, the momentum may continue in the Asian markets during their morning session and this could catalyze buyer demand to increase again.
Second, Bitcoin could consolidate under the all-time high at $19,873, possibly ranging between $19,000 and $19,873. This scenario is the most ideal for BTC to see a sustainable rally, as it would prevent the derivatives market from getting overheated.
Ever since XRP broke out of the tight multi-year trading range that it was previously stuck in, the cryptocurrency has been caught within a strong uptrend that has shown no signs of slowing down.
Bulls have been in full control of the previously embattled cryptocurrency, and the recent rebound seen across the entire market appears to be boosting XRP’s technical outlook as well.
The crypto is now in the process of moving up towards a key resistance level that has long been hampering its price action.
The visit to this level comes in the midst of Bitcoin and Ethereum both entering full-fledged bull trends, with BTC setting fresh all-time highs earlier today before facing a rejection at $19,800 that appears to have sparked another consolidation phase.
It remains unclear whether this consolidation phase will be short-lived or persist in the days to come, but the resistance between $19,500 and $20,000 does appear to be degrading.
One analyst is now noting that XRP is poised to rally higher against this backdrop of bullishness seen by BTC and other digital assets.
He believes that a break above $0.65 is all that is needed for it to gain some immense momentum and begin rallying higher.
XRP Reaches Crucial Resistance as Bull Market Ignites
At the time of writing, XRP is trading up just over 7% at its current price of $0.65. This is where it has been trading throughout the past few days, with the selling pressure here being significant.
Bulls were able to defend its recent back-test of its $0.45 support, a positive technical sign. Couple this with the market-wide bullishness seen as of late, and it does seem as though XRP may soon explode higher.
Analyst Claims XRP is Poised to Explode Higher
While sharing his thoughts on XRP’s current technical outlook, one trader explained that he expects it to see some serious near-term upside.
He notes that the recent test of the $0.45 level confirmed it as support and could boost it higher in the days to come.
“XRP: Higher timeframe support around $0.45 massively held for support. Therefore, strong bounce and looking at clear resistance at $0.65. If that breaks, likely continuation towards new highs.”
Image Courtesy of Michaël van de Poppe. Source: XRPUSD on TradingView.
So long as Bitcoin remains stable and pushes higher in the days and weeks ahead, there’s a strong possibility that XRP will aim for $1.00 next – assuming it can break above $0.65.
Featured image from Unsplash.
Charts from TradingView.
While Bitcoin (BTC) is facing a potential new all-time high, other coins are showing strength as well. One of those coins is XRP, which has been going vertical in the previous weeks.
XRP’s price surged from $0.22 to a high of $0.78 during the month of November, which immediately ended up in a massive correction toward $0.45.
Let’s take a look at the XRP price charts to determine whether this was an entry opportunity before the next leg up.
The crucial zone around $0.45 holds as support
XRP/USDT 1-day chart. Source:TradingView
The daily chart of XRP is showing clear support and resistance zones. Within such a heavy pump, the levels to watch can be derived from the daily time frame.
In this case, the first massive support zone is around the $0.45 barrier. XRP corrected toward this zone as the price of Bitcoin dropped to $16,200 on Thanksgiving day.
The chart shows a clear support bounce, as the price has gained more than 40% since.
If $0.45 failed to sustain support, the next support zone would have been around the $0.30 area, which is the previous resistance zone that was likely to be flipping support.
What are the new resistances if the XRP rally continues?
The next resistance zone now to break is the $0.69 area, which is crucial before $1.00 can come into play.
XRP/USD 1-day chart. Source:TradingView
There are a few useful tools to determine the potential resistance zones on the XRP chart. One of them is the Fibonacci extension tool.
The recent top is the “1” number on the Fibonacci extension tool, and the bottom around $0.20 as the “0.”
Therefore, the next likely resistance zone can be measured around the 1.618 Fibonacci level at $1.13. Similarly, the second zone is the zone around $1.70, which is the 2.618 Fibonacci level.
However, the first resistance zone between $1.08 and $1.18 is an important resistance zone, as it also acted as resistance throughout the 2017 cycle, as the chart shows. One can argue that a run toward $1.08 to $1.18 is likely once the area at $0.70 breaks.
The key level to watch for BTC/XRP
XRP/BTC 1-day chart. Source:TradingView
Once a price breaks above resistance, the next thing one would like to see is the previous resistance becoming support — if you’re a bull, that is.
The BTC/XRP chart is showing such a critical level (highlighted in green) that can flip to support. During the end of 2019 and the beginning of 2020, this area served as the range low and support for a substantial period.
However, it failed to sustain that support, leading to a drop to 0.00001500 thereafter.
With the recent breakout to 0.00004000 sats, the bulls will want to see a support/resistance flip of the 0.00002400 sats area. If that holds, XRP is likely to continue running toward the $1.00 barrier.
Lower time frame levels to watch on the XRP chart
XRP/USD 1-hour chart. Source:TradingView
The XRP/USD chart is showing an apparent breakout above $0.65. As long as that area sustains support and confirms the breakout, continuation toward $0.74 is on the table.
However, failing to break the $0.65 area means that a drop toward $0.55 will become the likely scenario.
The higher time frames give a clearer indication of where XRP is located in the market cycle. A multiyear downtrend was broken to the upside, meaning that dips will likely be considered as entry opportunities for traders.
With this in mind, if XRP holds $0.45 as support, continuation toward $1.00 is likely, particularly if Bitcoin price hits a new all-time high.
The views and opinions expressed here are solely those of theauthorand do not necessarily reflect the views of Cointelegraph. Every investment and trading move involves risk. You should conduct your own research when making a decision.
Today, Bitcoin price set a new all-time high record. While that statement certainly speaks for itself, it does beg the question: what comes next?
Given the fact that this hurdle was the one the entire investor class was watching, and it is now out of the way, the most logical next target could be $25,000. Here’s why this number is significant and why there’s a strong probability that price heads there next.
All-Time High Broken, Bitcoin Price To Return To Price Discovery Mode
For nearly three full years, crypto investors have been waiting for this day and wondering if it would even happen. Holding Bitcoin has been a rocky ride for those that got in at the peak of the last bubble.
After the cryptocurrency tapped the current level, it fell to $3,000 a year later. A revisit back to that key level earlier in the year sealed the deal on a new uptrend and canned any chances of the cryptocurrency dropping lower.
Related Reading | Here’s What Will Happen To Altcoins Once Bitcoin Breaks $20,000
From that bounce caused a sharp uptrend and now – as of today – Bitcoin price has set a new record.
The leading cryptocurrency by market cap is now below the previous high, but a spike higher today set a new all-time high record. The feat is likely to make waves across the finance space, and lure in another wave of investors, until the asset peaks and does it all again.
But before the bull market truly takes off, the next logical level, according to one crypto analyst, is right below $25,000 at $24,800.
The 1.272 Fibonacci extension is the next logical target for Bitcoin price | Source: BTCUSD on TradingView.com
Why Cryptocurrencies And Other Assets Respond To Fibonacci Levels
According to crypto analyst Jamie Holmes, the next target resides at the 1.272 Fibonacci extension level. Beyond there, 1.618, 2.618, and 3.618 sit at $30,000, $50,000, and roughly $75,000 respectively, and could be next after the first extension is taken out.
Holmes accurately called for the retest of ATH after a “bullish saucer” formed on monthly timeframes. Now he’s pointing to $25,000 next.
During the last bull market, Bitcoin rose as high as the 19.618 Fibonacci level, which could suggest that these early extensions will be barely a blink for the now unstoppable cryptocurrency.
Related Reading | Fibonacci Day: How To Use Math To Trade Bitcoin And Altcoins
It isn’t exactly clear why Fibonacci ratios and their retracement levels and extensions act as support and resistance, but they do for all asset types.
Breaking through the 0.618 Fib retracement level at $13,800 is what set off the recent bullish impulse and send the cryptocurrency to a new all-time as of today.
The 0.618 level could once again become a target to watch, and this time act as support for any major corrections that follow from here.
Featured image from Deposit Photos, Charts from TradingView.com
Bitcoin (BTC) reached a new all-time high on various exchanges on Nov. 30, but one record, in particular, hit the headlines for a different reason.
Data from cryptocurrency exchange Kraken shows BTC/USD hit its highest ever price on its order book — then dove to $16,600 in seconds.
Kraken BTC price dumps $3,000
The reason for the crash, which will have liquidated a large number of positions and caused considerable pain for many a speculator, was likely what is known as a “stop-loss run.”
Stop-loss runs involve large-volume traders who intentionally place large sell orders at a specific price point, then target where they think a large number of stop-loss positions reside. In this case, the target was around $16,600, near the location of last week’s local bottom.
The result is a cascade of selling pressure that very quickly delivers the result, if successfully estimated, only for the market to subsequently rebound once the process is over.
Liquidity risk is always a given factor in exchange trading, and Kraken’s one-minute wick down by $3,000 aptly demonstrates why traders should exercise caution around significant price points.
Another explanation, or possibly one that contributed to the event, was investors choosing to exit at near $20,000 in order to avoid the costs of a sudden reversal at resistance.
Bollinger cautions over “classic top formation”
“OK, time to pay attention, $BTCUSD. That is a classic top setup,” John Bollinger, creator of the Bollinger Bands volatility indicator, warned.
“No confirmation yet and the setup could easily be overrun, but wise traders should wash their glasses.”
When asked by a Twitter user if this is a local top or whether Bitcoin’s price will go down from here, he responded that “For now, a potential local top…”
Beyond Kraken, meanwhile, Bitstamp also reached its own all-time high at $19,869, with BTC/USD then falling toward $19,000, a level that the pair reclaimed just hours ago.
“For those who are feeling bullish about #Bitcoin, today is the day you’ve been waiting for,” exchange Binance meanwhile summarized.
The flagship cryptocurrency hit a fresh record high for the first time in three years as traders increased their bids in hopes of earning big profits. It was trading as high as $19,864 during the US session, up 9.16 percent on the day. That trampled its 2017 record high of $19,666, according to data fetched by Coinbase exchange.
Bitcoin is rallying relentlessly for the last 10 months. Source: BTCUSD on TradingView.com
Bitcoin is rallying relentlessly for the last 10 months. Source: BTCUSD on TradingView.com
The surge came as a part of a bigger and broader rally that started in March 2020. In the month, the Federal Reserve and other central banks injected trillions of dollars into their capital markets. The move weakened the US dollar’s purchasing power.
Meanwhile, the banks also introduced ultra-low interest rates while committing to purchase Treasuries endlessly. That pushed the real yields of the safest government bonds lower, prompting investors to seek profits in riskier assets. Bitcoin, the riskiest among them all, benefited as a result. It surged by up to 415 percent between March and today.
Bitcoin Meets Wall Street
Many analysts agreed that the latest rally came in response to investors’ fears of inflation, coupled with an unsettling gold market.
Guggenheim Partners, a Wall Street investment firm, said it could invest up to $530 million into BTC via Grayscale’s Bitcoin Trust. Meanwhile, Real Vision Group CEO Raoul Pal, who was earlier critical of Bitcoin, switched sides by announcing that he is reshuffling his entire gold portfolio into the cryptocurrency market.
“Ok, [the] last bomb,” he tweeted, “I have a sell order in tomorrow to sell all my gold and to scale in to buy BTC and ETH (80/20). I don’t own anything else (except some bond calls and some $’s). 98% of my liquid net worth.”
Cameron Winklevoss, the co-founder of Gemini, a cryptocurrency exchange in the United States, said:
“Bitcoin is an emergent store of value that defends against inflation and has the potential to unseat gold. This means it could appreciate 25x in value from $19K. No other liquid asset in the universe can credibly offer this magnitude of asymmetric payoff in the next decade.”
The sentiment allowed Bitcoin to break above major resistance levels in a row on Monday. Nevertheless, the cryptocurrency also pulled back lower after topping out, led by short-term profit-taking behavior among daytraders.
Bitcoin (BTC) returned to $19,000 on Nov. 30 as a weekend surge continued to produce fresh gains for investors and hodlers.
BTC price up 18% against weekly lows
Data from Cointelegraph Markets and TradingView showed BTC/USD retaking another key psychological level during Monday trading.
The weekend had already produced major upside for the pair, which late last week dived to $16,300. By the start of Monday, $18,600 had appeared, with Bitcoin going on to deliver returns of at least 17% versus those lows.
As Cointelegraph reported, a giant $1,300 CME futures gap threatens to take the market lower, but buyers so far remain unfazed. At press time, highs above $19,200 were in progress with around half an hour to go before the start of trading on Wall Street.
BTC/USD 1-day hourly chart. Source: TradingView
“Leveling up. The crucial area around $17,800 held,” Cointelegraph Markets analyst Michaël van de Poppe summarized just prior to the $19,000 move.
“Now the crucial area is $18,200 and the final breaker before ATH is the resistance around $18,600-18,900.”
Should Bitcoin manage to flip that zone to support, the door remains open for another attempt at challenging $20,000. Last week, however, $19,500 provided firm resistance.
Following what is described as an “epic bear trap” to $16,400, Bitcoin has officially set a fresh all-time high.
The benchmark digital asset has never traded as a price this high on the spot market before, with bulls now trying to push it above $20,000. It does appear to be facing some resistance as it navigates into this price region, with bears ardently attempting to fade the movement.
Regardless of whether they are successful, the cryptocurrency’s historic move higher this morning will likely market a macro turning point for BTC and the entire crypto market.
Once $20,000 is broken above, there’s a strong likelihood that it will enter price discovery mode and see some serious upside. Parabolic advances like the one it is currently caught within often end in an asset’s price multiplying, which could mean that this is just the beginning of a much larger move.
One trader is now noting that BTC could be well-poised to see some immense upside in the near-term, with the latest decline simply being a bear trap that cleared out over-leveraged long positions and reset the sentiment surrounding the crypto.
Bitcoin Explodes Towards $20,000; Sets Fresh All-Time Highs
At the time of writing, Bitcoin is trading up just over 7% at its current price of $19,500. This marks a slight decline from highs of $19,800 that were set just a few minutes ago.
These highs marked fresh all-time highs for spot BTC, but it does appear that bears are putting up a defense of the upper-$20,000 region.
Typically, once an asset sets fresh all-time highs, it enters a price discovery mode that leads it to see significantly further gains.
This will likely take place for BTC once $20,000 has been firmly broken above and established as a support level.
BTC Rallies on the Heels of an “Epic Bear Trap”
A few days ago, Bitcoin’s price reeled from the mid-$19,000 region to lows of $16,400.
This shifted the market’s sentiment and led many investors to believe that BTC had posted a local top.
One analyst spoke about this move in a recent tweet, calling it an “epic bear trap”
“BTC: Bitcoin price crushing the daily high. Yeah, that move down to $16k was an epic bear trap to try and shake people out before $20k.”
Image Courtesy of Josh Rager. Source: BTCUSD on TradingView.
The coming few days should provide insights into Bitcoin’s macro-outlook. Whether or not it can break above $20,000 and flip this into support will likely determine how it trends into the end of the year.
Featured image from Unsplash.
Charts from TradingView.
Bitcoin (BTC) is back this week as a rebound takes the largest cryptocurrency ever closer to new all-time highs — what’s in store?
Cointelegraph takes a look what could move Bitcoin markets in the coming days as buyers emerge and $16,000 gets left behind — at least for now.
Bitcoin cancels Black Friday discounts
The main story among Bitcoiners on Monday is its performance over the weekend.
After plumbing depths of $16,300 last week and failing to get much higher than $17,000 in the days following, Bitcoin surprised on Saturday, beginning a climb that has reached $18,600 on Nov. 30.
The timing led to comparisons to Black Friday, as BTC/USD fell in time for the infamous discount day and rose back up afterward.
“Guess the Black Friday bitcoin sale is officially over. Hope you stocked up,” Barry Silbert, CEO of asset management giant Grayscale summarized.
At press-time levels of $18,550, Bitcoin is now up almost 14% versus the lows, recouping the majority of its losses from when it fell from $19,500. This will be a familiar sight for traders, who will now be eyeing the potential for Bitcoin to avoid the psychological selling pressure which so clearly set in near the all-time highs of $20,000.
“Crucial level to hold is the $17,700-17,850 breaker. If that is lost, I think we’ll see the 16’s again,” Cointelegraph Markets analyst Michaël van de Poppe said in his latest analysis on Sunday.
Van de Poppe likewise highlighted the area around $18,500 and $18,700 as the crucial breakout point to fuel further bullishness. Bitcoin subsequently hit the midpoint of that range, but has so far failed to turn it into a launchpad for reclaiming any higher levels.
Nonetheless, should current levels hold, Bitcoin will easily see its highest ever monthly close at the end of Monday.
BTC/USD 1-week hourly chart. Source: TradingView
$1,300 Bitcoin futures gap opens lower
One major argument for Bitcoin reversing downwards for its next move comes in the form of a classic “gap” setup on futures markets.
Thanks to the weekend’s volatility, Monday has begun with a noticeable “gap” on the charts at CME Bitcoin Futures, this one lying $1,500 lower than the current spot price.
Gaps refer to the empty space left between the end of Friday trading and the start of Monday trading for futures, and the latest one to open is $1,300 in size — one of the largest ever.
Historically, Bitcoin has opted to rise or fall to “fill” such gaps once they appear, and this has tended to occur quickly, meaning that the chance is there for a fresh dip to as low as $16,990 — the beginning of the gap.
A further albeit much smaller gap remains “unfilled” from previous trading at around $19,000.
CME Group Bitcoin futures chart showing gaps. Source: TradingView
“It all depends on how harshly we reject in this range and how we are going to react around the support at $17,000, which is also the weekly close on the CME futures,” Van de Poppe commented.
He also noted that one weekend’s upside is no good as a starting point for being bullish. Entering Bitcoin is a wise move only when support is reached on higher timeframe support levels, meaning that the CME gap should be resolved by the time that the real state of the market becomes more obvious.
An accompanying survey meanwhile showed a fairly even split between 6,000 respondents regarding whether BTC/USD would hit $14,000 or $22,000 first.
Stocks drop after record month
Outside Bitcoin, the macro picture is mixed as the month ends. November saw 13% for equities worldwide, a record month as expectations of a Coronavirus vaccine ran high.
On Monday, however, progress began to retreat, with China leading a turnaround from gains to losses and European futures following suit.
The U.S. dollar, already under pressure, is expected to dip to its lowest levels since April 2018, Bloomberg reported on the day. As noted by Cointelegraph, the U.S. dollar currency index (DXY) has been steadily falling over the past weeks, erasing some previous gains.
Bitcoin typically reacts favorably to DXY weakness, and while its relationship to macro assets more broadly is waning, abrupt movements in the index remain apt to dictate short-term market direction.
At press time, DXY stood at 91.72, having broken the 92 support level, which was preserved even in August when Bitcoin hit $12,000 for the first time this year.
U.S. dollar currency index 1-week hourly chart. Source: TradingView
Virus-induced headaches meanwhile continue across the Western world. The United Kingdom’s economy, according to estimates from Bloomberg shared by market commentator Holger Zschaepitz, will contract by the most in over 300 years.
Market-specific issues, such as Tesla debuting on the S&P 500, are also on the radar.
“Extreme greed” characterizes macro
“Extreme greed” is what is characterizing investor sentiment in both cryptocurrency and traditional markets, according to classic indicator the Fear & Greed Index.
A popular sentiment gauge for crypto in paritcualr, the Index uses a basket of factors to assess how overbought or oversold the market is based on investor behavior. A normalized score out of 100, the higher the reading, the more likely the market is due for a correction.
Cointelegraph has frequently reported on the Crypto Fear & Greed Index in recent times as it heads towards all-time highs of 95/100. A recent peak of 94 came just prior to BTC/USD shedding $3,000 in a day.
On Monday, the Index stood at 88 — lower than before but still firmly in the “extreme greed” category.
Crypto Fear & Greed Index one-year chart. Source: Alternative.me
For Zschaepitz, however, the identical “extreme greed” rating for traditional markets is being distorted thanks to the interventions by central banks as part of Coronavirus measures.
“Just to put things into perspective: CNN‘s Fear & Greed Index has risen to 92 as investors have become extreme greedy,” he wrote on Sunday.
“But maybe that greed is mainly driven by CenBank liquidity so this is no longer an reliable indicator for an imminent correction!”
Traditional markets Fear & Greed Index. Source: CNN
Central banks have bought up a huge range of bad assets in order to give the illusion of competition on the market since March this year, a move which has garnered considerable criticism from Bitcoin circles.
Leave it to the pro buyers?
As quant analyst PlanB acknowledged in a timely reminder on Sunday, a new week means a new round of Bitcoin buying by a group of familiar faces: Grayscale, Square and PayPal.
As last week, the corporate giants will need to satisfy client demand by buying up the diminishing number of coins available at current prices.
This new status quo, formed when PayPal released its cryptocurrency features, has led to estimates showing that there is simply not enough Bitcoin to go around. The three companies’ needs are more than miners can produce, and still compete with demand from elsewhere.
The only logical outcome, should demand increase or stay the same, is for the price of Bitcoin in other assets to rise — a simple equation of supply and demand.
In an interview with CNBC last week, Dan Schulman, PayPal’s CEO, said that the company was betting on Bitcoin becoming more widely used as a currency.
The price of Bitcoin has surpassed $19,300 once again, after dropping to as low as $16,200 on November 26. Following BTC’s surprising intraday rally, analysts say it is preparing for an all-time high.
There were convincing arguments for both bearish and bullish short-term projections for BTC. Most notably, when BTC dropped down to $16,200, it broke out of the recent parabola. This meant that BTC was at risk of either a large correction or beginning a new uptrend.
So far, based on the strength of BTC’s upward movement, market trends show that it could begin a new parabolic rally.
The daily price chart of Bitcoin. Source: BTCUSDT on TradingView.com
What Happens When Bitcoin Breaks $19,400?
There are two main scenarios for Bitcoin in the near term. First, BTC breaks $19,400, head towards the all-time high, and test the $20,000 level.
Second, BTC rejects $19,400 again, it ranges in the near term and consolidates, as it attempts to break out once again
But, if Bitcoin surges past $19,400, a technical analyst and trader known as “Bitcoin Jack” said an all-time high becomes more likely. He said:
“I hate to say it but BTC is literally at its last lines of defense before making ATH Volume is picking up, bullish breakouts on the LTF Failure to see a rejection at 19K and there is pretty much nothing that stand in its way Good game bulls.”
Why BTC Rose so Quickly
The primary reason behind the current rally of Bitcoin seems to be a large-scale short squeeze.
Prior to the rally, across major cryptocurrency exchanges including Binance Futures, BTC saw large short positions get liquidated.
When a short position gets liquidated, it forces the holder to market buy the position. As such, shorts can turn into short-term buyer demand for BTC in a short period.
A pseudonymous trader known as “Byzantine General” said:
“[Binance] is going for round 2. Coinbase & Finex have entered the chat. 18900 – 19000 will be a bloodbath.”
In the near term, the two key resistance levels for Bitcoin are at $19,400 and $20,000, both of which would likely see a strong reaction from the market.
Punters lost £700m less on gambling machines in the year after fixed-odds betting terminals (FOBTs) were reined in but industry predictions of mass job losses if ministers went ahead with the policy have not materialised.
As the gambling regulator released fresh data charting the impact of curbs on the roulette machines, campaigners said the figures showed that ministers poised to launch a wide-ranging review of gambling laws should beware industry forecasts.
Before last year’s decision to slash the maximum stake on FOBTs from £100 to £2, gambling lobbyists repeatedly warned that a cut could force 4,500 shops to close at a cost of 21,000 jobs.
But figures for the year to the end of March 2020 show that the number of high street bookmakers decreased by 639 to 7,681 in the first full year with reduced FOBT income.
The 7.5% decline is partly a result of gambling firms wooing customers online, where its costs are far lower than running bricks-and-mortar stores. The migration was already causing the UK’s network of high street bookmakers to shrink by about 3% a year.
Matt Zarb-Cousin, who campaigned against FOBTs and now advocates for broader reform via his Clean Up Gambling group, called on ministers to take industry claims with a pinch of salt as they consider an overhaul of gambling laws.
“This shows the predictions of doom from the bookmakers were dramatically overstated. Crying wolf won’t help their credibility in the upcoming gambling review.”
The Gambling Commission’s figures show the extent to which gamblers’ spending has changed since £100-a-spin FOBTs were reined in, with punters losing significantly less overall.
The amount lost on fixed-odds betting terminals tumbled from £1.16bn to £12m in the year to the end of March 2020, as the vast majority of FOBTs were rewired to offer lower stakes “B3” games.
B3 spending jumped from £1.1bn to £1.5bn as a result, indicating a significant switch to £2-a-spin products, where average loss rates are similar over time but huge, potentially life-altering one-off losses are much less common.
Overall, gamblers’ spending on machine-based betting in bookmakers fell by £700m to just under £2.1bn. Coupled with the effects of 11 days of coronavirus lockdown to the end of March, the 26% fall in machine income sent bookmakers’ revenues down from £3.26bn to £2.4bn during the year.
The land-based casino industry supported the FOBT cut, something bookmakers have previously said indicated that casino owners hoped to pick up business from players seeking high-stakes roulette elsewhere.
But casinos do not appear to have benefited, suffering a slight decline in income to just above £1bn.
Online casino betting increased by £100m to the highest ever figure of £3.175bn, in line with long-term trends. The biggest increase in spending came in the fast-growing online sports betting category, where punters lost a record £2.3bn. The National Lottery also enjoyed a significant increase, up by more than £300m to £3.4bn.
The ongoing Bitcoin (BTC) rally has primarily been driven by institutions, analysts say, with metrics such as CME’s open interest and Grayscale’s assets under management (AUM), supporting this narrative.
At the same time, the gold market has seen large outflows in recent weeks. On Nov. 24, independent financial researcher Jan Nieuwenhuijs reported that gold saw its largest weekly outflow in history.
The timing of the heightened level of outflows from the gold market is noteworthy because it comes after the entrance of major institutional investors into the Bitcoin market.
Cointelegraph reported that Guggenheim Partners, which manages $275 billion in assets, is the latest institution to show interest in Bitcoin.
What does this mean for Bitcoin?
In the medium to long term, the inflow of institutional capital into Bitcoin could lead to two key trends.
First, Bitcoin could see a more sustained uptrend that has emerged since September. Institutions, especially those gaining exposure to BTC through the Grayscale Bitcoin Trust, are likely accumulating BTC with a long-term strategy.
Some long-time Bitcoin investors, who had gold positions for prolonged periods, have also started to allocate their capital fully into BTC. Raoul Pal, the CEO of Real Vision Group, said:
“Ok, last bomb – I have a sell order in tomorrow to sell all my gold and to scale in to buy BTC and ETH (80/20). I dont own anything else (except some bond calls and some $’s). 98% of my liquid net worth. See, you can’t categorize me except #irresponsiblylong Good night all.”
Second, fund managers say that this could make Bitcoin even more dominant in the cryptocurrency market. Currently, the market cap of Bitcoin accounts for 63.83% of the global cryptocurrency market’s valuation.
Bitcoin dominance index. Source: Coinmarketcap
Kyle Davies, the co-founder at Three Arrows Capital, one of the largest funds in the cryptocurrency sector, said:
“No one goes gold -> $BTC -> alts This year has seen big high net worth inflows from USD or gold to BTC. This is not retail. These guys aren’t going into ripples.”
The near-term trend of BTC remains uncertain
Bitcoin has seen strong momentum throughout the past three months, barely seeing major corrections.
During previous bull cycles, it’s not uncommon for BTC to see 30% pullbacks, and the recent run is yet to post a major downturn. But, in the near term, on-chain analysts say that BTC could be braced for a deeper drop.
Bitcoin All Exchanges Outflow Mean. Source: CryptoQuant
Ki Young Ju, the CEO of CryptoQuant, said that whales are keeping more BTC on exchanges than in the past few months. This could indicate that whales could sell more BTC in the foreseeable future. He said:
“The fact that whales don’t withdraw means that $BTC is available for selling. If whales think the price will go up, they’ll withdraw $BTC a lot. I don’t know when it’ll start, but if the price drops, whales will react to the price and make high volatility.”
Whether the buyer demand from institutions and their Time-weighted Average Price (TWAP) algorithms would counter the selling pressure from whales would likely dictate the short-term price cycle of BTC.
Traders are flocking to Bitcoin in search of digital gold, but the journey can be costly and confusing, with hidden fees and cumbersome interfaces, making it difficult to navigate the market successfully.
eToro makes cryptocurrency trading costs crystal clear. There are no fees buried in the fine print, and an intuitive user interface helps you avoid expensive misclicks.
Be aware of hidden fees
On eToro, trading costs are contained in a single charge. The percentage of the spread for buy and sell is the entire cost of the trade — zero fees, no hidden fees, nothing!
Depositing US dollars on eToro is completely free, and a flat fee of $5 is charged to cover the processing cost of withdrawals. If you are depositing in another currency, an FX conversion fee may apply, but costs are made clear in advance, unlike other platforms that often levy unstated conversion fees.
Fee example
Initial investment
$2,000 USD
BTC buy price*
$20,000 USD
Position size
0.1 units
eToro typical spread for BTC
0.75%
Total round trip (buy and sell) fees:
$15 USD
(0.75% *20,000 USD * 0.1 units)
*Example price
To buy and sell 0.1 unit of Bitcoin in a round trip when the price is at $20K, you would pay a single spread fee of 0.75%, or $15 USD.
Most other trading platforms charge a set commission as a percentage of the position size. But high spreads — the difference between the buying and selling price — mean the real cost is higher.
In addition, account maintenance and inactivity fees can be hidden away in the terms and conditions, eating into profits and adding to losses each time you place a trade.
Even depositing funds can cost up to 5%, with traders often paying their card service providers significantly more for the convenience of paying by card, leaving them with a loss before they have even started trading.
When the time comes to withdraw, traders can be hit with more costs, paying super high flat fees to send funds back to a bank account.
With eToro, we take care to do things as clearly and as simply as possible — you pay only for the spread, with no additional transaction fees.
Smoothly navigate the market
Instead of a complex interface that leaves new traders one misclick from disaster, eToro offers a seamless user experience.
Traders can engage with the basic mechanics of the Bitcoin market through a streamlined process that begins the moment funds are deposited.
eToro is one of the only exchanges supporting PayPal, along with multiple other deposit methods, including bank transfer, card payment, Skrill, Neteller, WebMoney, and Yandex (depending on region). With funds on the platform, you can then buy and sell easily through an intuitive and user-friendly interface, making managing your portfolio completely painless.
To test the water, eToro gives you a free $100,000 demo account. This lets you build a virtual portfolio and test innovations like copy trading, risk free.
This unique trading toolkit, combined with clear pricing and an intuitive user interface, means Bitcoin trading is no longer costly and confusing.
This ad promotes crypto investing, which is highly volatile and unregulated. Trading cryptoassets with leverage is regulated and comes with a high risk of losing money. Buying cryptoassets is unregulated in most EU countries and therefore is not supervised by EU regulatory frameworks and carries no EU protections. Your capital is at risk.
Top decentralized finance (DeFi) coins such as AAVE are outperforming over the past day. While Bitcoin and Ethereum are both up massively today, AAVE is up 18.5% in the past 24 hours alone. This performance makes it the best-performing digital asset in the top 100 by market capitalization. AAVE is now up by approximately 10% on the week, per CoinGecko data.
This rally highlights a growing/continued interest in DeFi, which has continued to gain fundamental strength despite shaky price action. The number of DeFi users is soon expected to reach one million, by some estimates, making it one of the first crypto technologies to be adopted by many.
Aave stands to benefit from this trend as it sits at the core of the ecosystem as a money market for lending and borrowing.
Related Reading: Here’s Why Ethereum’s DeFi Market May Be Near A Bottom
AAVE Erupts 20% Higher
AAVE is up 20% in the past 24 hours alone amid strength in the price of ETH.
Ethereum has gained around 5% in the past 24 hours, pushing to $580 after consolidating under $540 for a number of days.
These gains to be trickling down to top Ethereum-based coins such as AAVE.
AAVE is one of the leading Ethereum-based, DeFi coins, touting a valuation of $890 million. It is a governance token that allows users to govern the Aave protocol; the coin is also used as a backstop for the protocol in case of a glitch.
This latest leg higher comes as Aave has set a key milestone. As pointed out by Marc Zeller, who is part of the Aave core team:
“The 3 comas club has a brand new member with the @AaveAave Flash loans. 1 Billion thanks to all the devs being pioneers of innovation, @DeFiSaver @fifikobayashi, and all the others. Can’t wait to see y’all all experiment with Seamless Loans made possible with @AaveAave v2.”
Related Reading: Tyler Winklevoss: A “Tsunami” of Capital Is Coming For Bitcoin
DeFi Back in Vogue
This rally comes as the fundamentals of the DeFi space have continued to improve at a rapid clip.
According to top data tracker DeFi Pulse, the total locked value of coins in decentralized finance contracts just surmounted $14 billion.
This is up from approximately $500 million, where this metric started in 2020.
Analysts are optimistic that there will be further growth in the DeFi space amid positive technological and price developments. This should result in further growth in the values of top coins pertaining to the space.
Related Reading: 3 Bitcoin On-Chain Trends Show a Macro Bull Market Is Brewing
Featured Image from Shutterstock
Price tags: xbtusd, btcusd, btcusdt
Charts from TradingView.com
Aave Surges 20% as DeFi Coins Begin Resurgence, Following Ethereum Rally
Chainlink (LINK) remained stable above the $11.50 support and started a fresh increase, similar to bitcoin. The price is now trading above $13.50 and it could continue to rise above $15.00.
Chainlink token price regained traction and climbed above $13.00 against the US dollar.
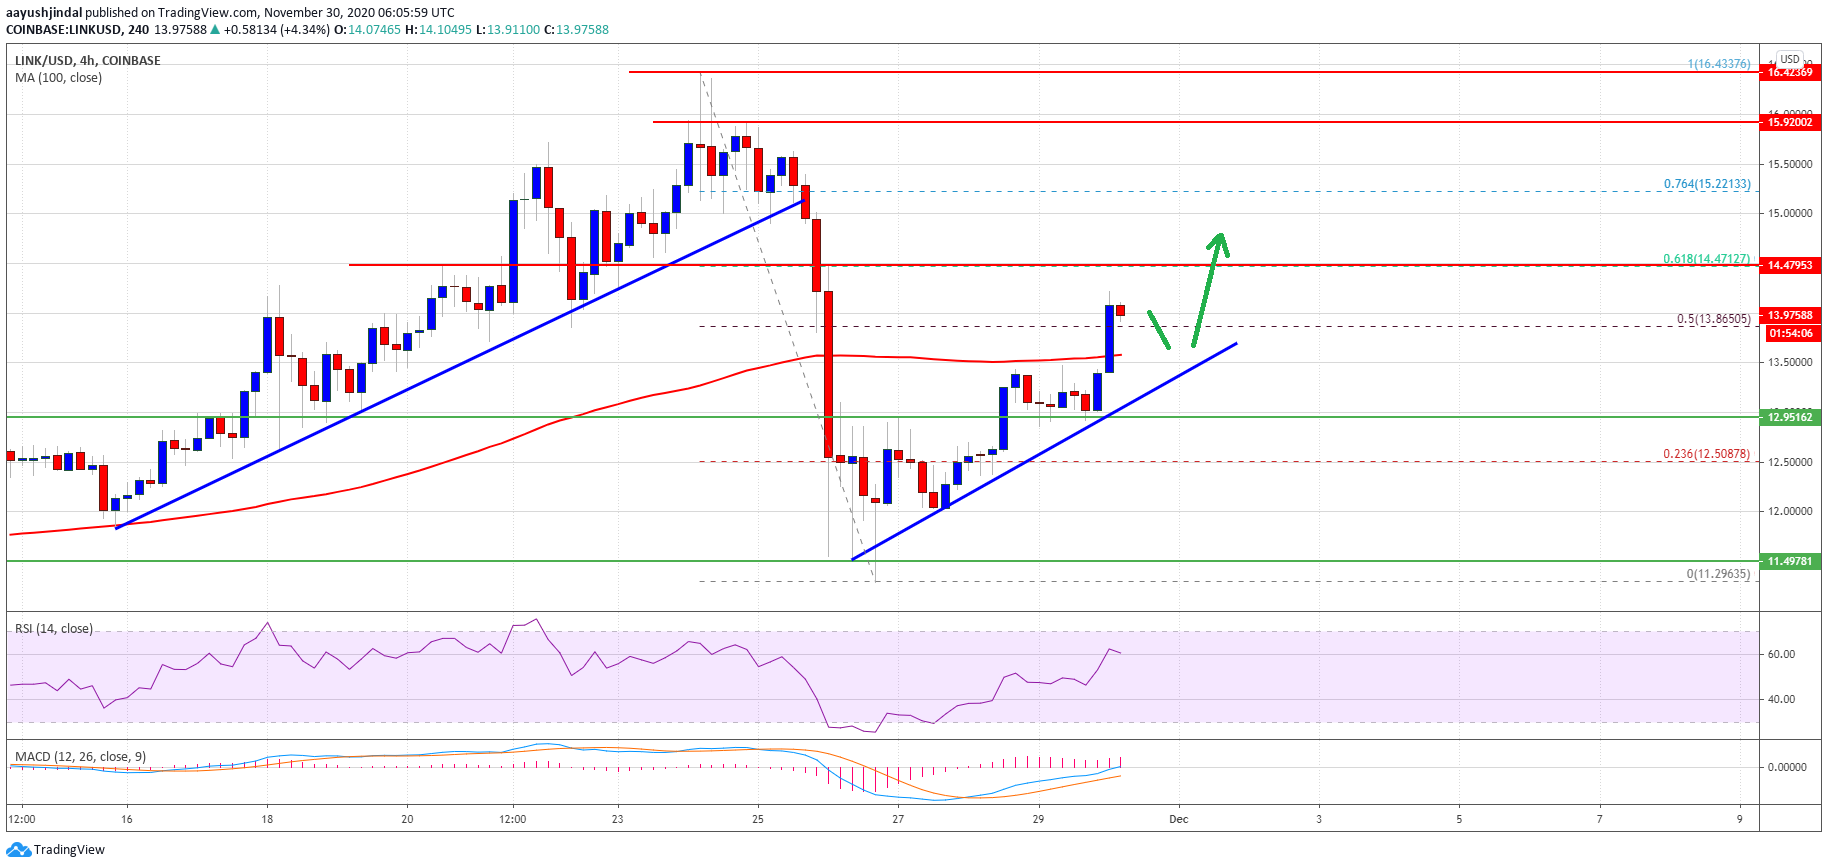
The price is now trading above $13.50 and settled above the 100 simple moving average (4-hours).
There is a key bullish trend line forming with support near $13.50 on the 4-hours chart of the LINK/USD pair (data source from Kraken).
The price is likely to continue higher above the $14.50 and $15.00 resistance levels.
Chainlink (LINK) Is Gaining Momentum
This past week, we saw a sharp downside correction in bitcoin, Ethereum, ripple, bitcoin cash, chainlink (LINK), and other major altcoins. LINK price dived from well above $15.50 and declined below the $13.50 support.
There was also a break below the $12.40 support and the 100 simple moving average (4-hours). Finally, the bulls were able to protect the $11.50 support zone. A low was formed near $11.29 and the price started a fresh increase above $12.00.
There was a break above the $13.00 resistance and the 100 simple moving average (4-hours). LINK price surpassed the 50% Fib retracement level of the downside correction from the $16.43 swing high to $11.29 swing low.
Source: LINKUSD on TradingView.com
The price is now trading nicely above the $13.85 resistance. There is also a key bullish trend line forming with support near $13.50 on the 4-hours chart of the LINK/USD pair. On the upside, the bulls are likely to face hurdles near the $14.50 level.
The 61.8% Fib retracement level of the downside correction from the $16.43 swing high to $11.29 swing low is also at $14.50 to prevent gains. A clear break above $14.50 could open the doors for more gains above $15.00 and $15.20.
Downsides Limited?
An initial support for chainlink’s price is near the $13.65 and $13.55 levels. The first major support is forming near the $13.50 level and the trend line.
If there is a downside break and close below the $13.50 support zone, there is a risk of a bearish move towards the $13.00 support level or even towards the $12.50 level.
Technical Indicators
4-hours MACD – The MACD for LINK/USD is now losing momentum in the bullish zone.
4-hours RSI (Relative Strength Index) – The RSI for LINK/USD is currently well above the 50 level.
Major Support Levels – $13.65, $13.50 and $13.00.
Major Resistance Levels – $14.50, $15.00 and $15.50.


 An ascending triangle could be forming as Bitcoin is ahead of schedule | Source: BTCUSD on TradingView.com