Bitcoin price traded to a new monthly high at $14,081 before starting a downside correction against the US Dollar. BTC is now approaching the $13,600 and $13,500 support levels.
Bitcoin extended its rise above the $13,500 and $13,800 resistance levels.
The price traded as high as $14,081 and settled well above the 100 simple moving average (4-hours).
There is a key rising channel forming with support near $13,600 on the 4-hours chart of the BTC/USD pair (data feed from Kraken).
The pair could resume its rise as long as it is trading above the $13,600 and $13,500 support levels.
Bitcoin Price Correcting Gains
This past week, bitcoin followed a bullish path above the $13,000 resistance against the US Dollar. The BTC/USD pair broke many hurdles near $13,500 and $13,800 to move further into a positive zone.
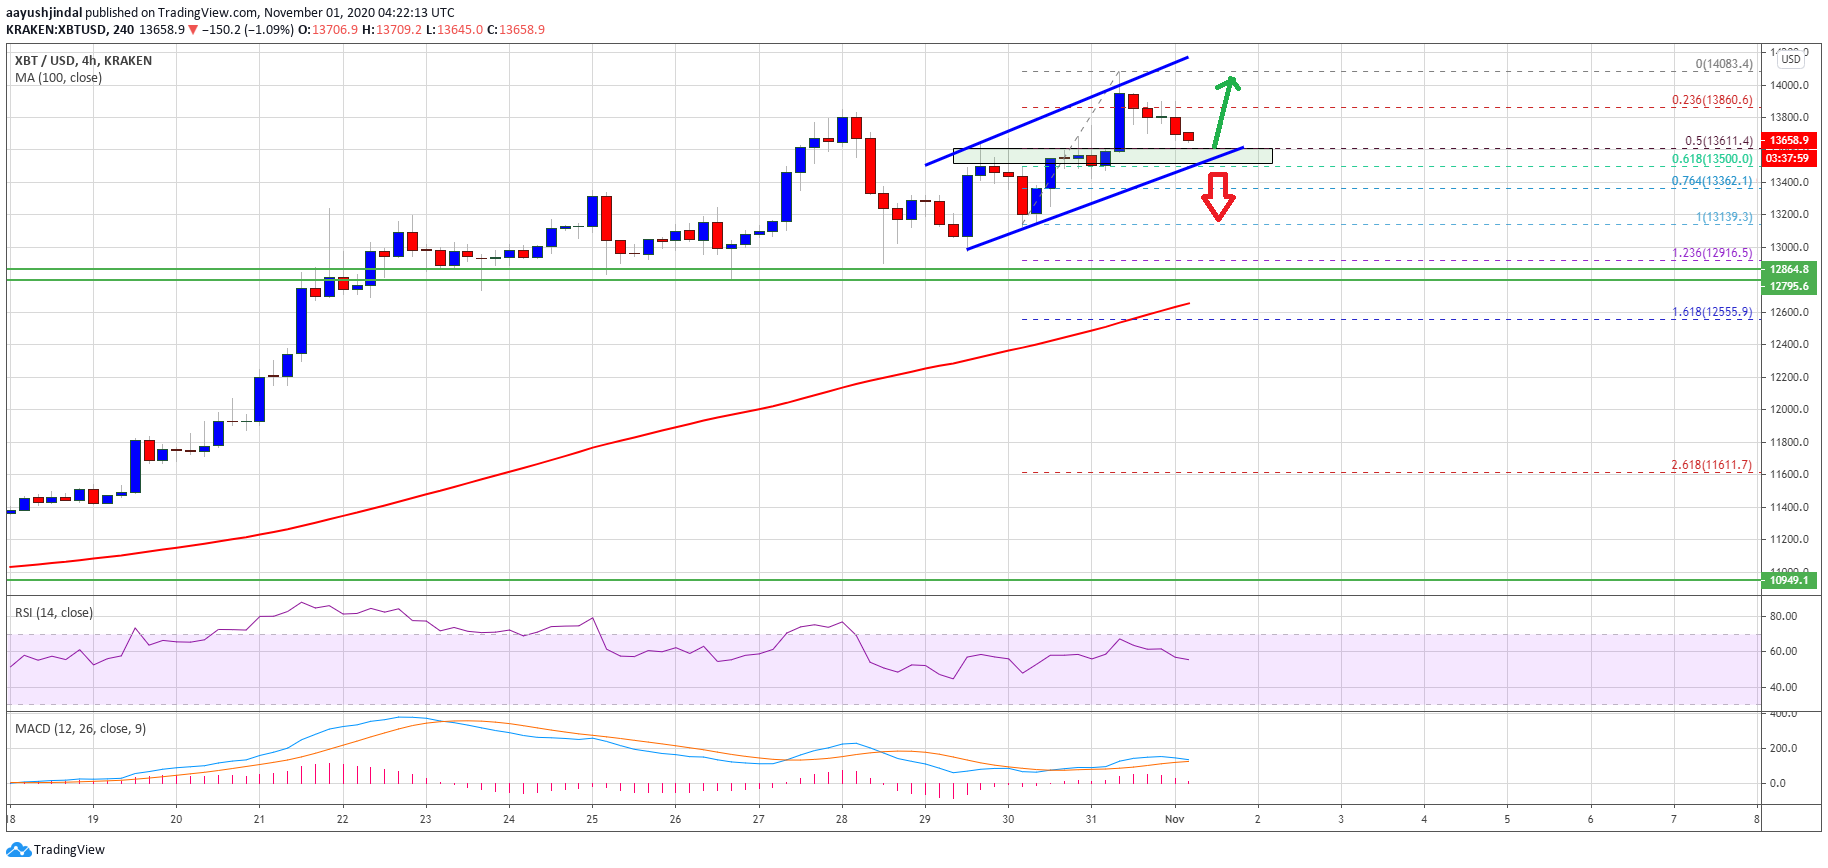
It traded as high as $14,081 and settled well above the 100 simple moving average (4-hours). Recently, the price started a downside correction and traded below $14,000 and $13,800. There was a break below the 23.6% Fib retracement level of the upward move from the $13,139 swing low to $14,081 high.
Bitcoin price is now approaching the $13,600 support zone. There is also a key rising channel forming with support near $13,600 on the 4-hours chart of the BTC/USD pair.
Source: BTCUSD on TradingView.com
The channel support is close to the 50% Fib retracement level of the upward move from the $13,139 swing low to $14,081 high. On the upside, the $13,800 level is an initial hurdle for the bulls. The main resistance is now forming near the $14,000 level.
A successful daily close above the $14,000 resistance level might open the doors for more upsides. The next stop for the bulls could be $14,400 or even $14,650.
Downsides Could Be Limited in BTC
If bitcoin fails to clear regain strength above the $13,800 resistance, it could correct lower. An initial support is near the channel trend line zone and the $13,600 level.
The next major support is near the $13,500 level. A downside break below the $13,600 and $13,500 support levels could push the price towards the $13,000 support in the near term.
Technical indicators
4 hours MACD – The MACD for BTC/USD is likely to move into the bearish zone.
4 hours RSI (Relative Strength Index) – The RSI for BTC/USD is still well above the 50 level.
Yearn.finance (YFI) underwent a strong bounce on Friday after the coin hit multi-week lows of $9,800. The cryptocurrency surged around 20% from $9,800 to $11,900 over the span of eight hours.
But unfortunately for buyers of the cryptocurrency, it has continued to decline. Yearn.finance’s governance token currently trades for $10,500, failing to hold the aforementioned highs despite strength in the Bitcoin price.
Related Reading: Here’s Why Ethereum’s DeFi Market May Be Near A Bottom
Yearn.finance Drops Toward $10,000
YFI currently trades for $10,500, down over 10% from the local highs of $11,900.
Market data suggests that this continued sell-off is a byproduct of futures short selling. Mechanism Capital’s Andrew Kang shared the tweet seen below on October 30th, noting that YFI’s recent downward price action has been predicated on the open interest of Binance’s YFI futures market rising. This indicates that investors may be increasingly shorting the asset, resulting in downward price action.
There were also a number of transactions spotted by investors where early YFI adopters deposited large sums of the cryptocurrency into Binance. It is believed that those coins were sold for fiat, resulting in some of the downward price action we are seeing now.
OI on $YFI at new ATHs, surpassing first capitulation at 12k earlier this month
12k-15k liquidity capitulated into high volume at 10ks (same as first capitulation into 12ks
The drop in the price of the Yearn.finance coin comes in the face of positive fundamental trends. Yields offered by the protocol’s Vaults products have begun to move higher as fresh strategies have been activated. Yearn.finance developers are also expected to roll out Vaults V2 shortly, which should further improve the performance of the protocol and fees accrued to YFI holders.
Related Reading: Tyler Winklevoss: A “Tsunami” of Capital Is Coming For Bitcoin
Expect Altcoins to Underperform?
While YFI may have fundamentals going for it, they may not be enough to stop the cryptocurrency from underperforming relative to Bitcoin.
Su Zhu, CIO and CEO of Three Arrows Capital, recently stated that Bitcoin rallying rapidly will automatically compress altcoin returns:
“$BTCgoing up swiftly is not only not bullish for alts but it’s bearish. Reasons for this are myriad but boil down to the fact that money is a coordination game and Bitcoin is the Schelling point; this is independent of how you feel about it, community is literally irrelevant.”
Analyst Qiao Wang also recently stated that he wouldn’t be surprised to see DeFi coins such as Yearn.finance’s YFI drop further from here.
Related Reading: 3 Bitcoin On-Chain Trends Show a Macro Bull Market Is Brewing
Featured Image from Shutterstock
Price tags: YFIUSD, YFIBTC, YFIETH
Charts from TradingView.com
Yearn.finance (YFI) Plunges Back Toward $10,000 Despite 15% Relief Rally
Ethereum has strongly underperformed over recent days, but it may bounce soon.
One trader noted that the coin has reached an important technical support level as per the Ichimoku Cloud.
This is likely to result in a bounce, analysts say.
Ethereum Poised to See Rally as Crucial Support Is Hit
Ethereum has strongly underperformed over recent days. The leading cryptocurrency has slipped from around $420 to $386, despite the price of Bitcoin setting new year-to-date highs in a strong surge upward.
This underperformance has shocked many investors. But according to an analyst, Ethereum is primed to move higher in the days and weeks ahead.
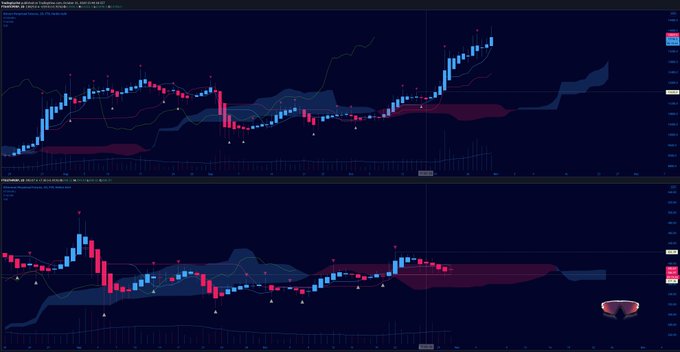
One crypto-asset analyst shared the chart below recently. It shows that Ethereum has reached an important technical support level that marked the highs of the short-term rally earlier this month. Analysts think that Ethereum will bounce from here:
“I do believe $ETH will bounce very hard from this daily Kijun. Currently Heikin Ashi indecision candle setting up just above this area of support. We could flip the daily trend tomorrow or Monday.”
Chart of ETH's price action over the past few weeks with analysis by crypto trader Trading Cyclist (@Fullgastrader on Twitter).
Source: ETHUSD from TradingView.com
This latest analysis comes shortly after the same trader noted that the cryptocurrency has printed a number of bullish Ichimoku Cloud signals.
“$ETH hasn’t even started yet: retested the flat Tenkan, chikou pointing up after bounce on Kumo, bullish future (twist). Spot buys done here Ballot box with check. Opening Perps on 1st blue HA candle / break of WF.”
Bitcoin Is Also Bullish
Bitcoin itself is also bullish, increasing the chance the leading altcoin moves to the upside. Qiao Wang, a prominent industry analyst, recently commented:
“#BTC has been shrugging off 3 simultaneous narratives from the traditional market – election, covid, and stimulus – as well a bunch of crypto exchange FUD since September. If you are not convinced we are in the early stage of a BTC bull market you’ve not been paying attention.”
The cryptocurrency’s technical trends are also in a positive state. Analysts note that the cryptocurrency closing its monthly candle above $13,000 is extremely positive for the bull case.
There is the concern that Bitcoin failed to move above $14,000 on the monthly candle but this is not a large concern yet as prices hold steady.
Featured Image from Shutterstock
Price tags: ethusd, ethbtc
Charts from TradingView.com
Ethereum Is At a Pivotal Support—and That's Good for the Bull Case
Chainlink’s price action has been rather lackluster as of late, with its price lacking a clear trend as it consolidates alongside Ethereum and the rest of the crypto market.
However, there’s a strong possibility that this will soon shift as Bitcoin’s ongoing uptrend will eventually lead to a capital rotation even that causes significant inflows of capital to move from BTC and into higher-risk assets like altcoins.
Once this occurs, LINK will likely be one of the first altcoins to gain some serious momentum due to its tendency to post parabolic movements.
Not only is Chainlink bullish from a technical standpoint, with strong support below $11.00 sparking rebounds with every attempted selloff, but the cryptocurrency also has some fundamental factors playing in its favor.
According to one analytics firm, the top 100 Chainlink holders have been aggressively accumulating at these price levels, providing it with strong buy-side support and showing that large investors are confident that upside is imminent.
Chainlink Continues Consolidating Above $11.00 as Altcoins Struggle to Gain Momentum
At the time of writing, Chainlink is trading up just under 1% at its current price of $11.15. This is around where it has been trading for the past several days.
Overnight, LINK’s price dipped as low as $10.80, but the buying pressure here was significant and stopped it from seeing any intense selloff.
It has been struggling to gain any momentum as of late, and it is becoming closely tied to Ethereum’s price action.
ETH has been guiding most altcoins, so until it catches a tailwind from Bitcoin and pushes higher, there’s a strong chance that Chainlink and most other altcoins will also continue consolidating.
Analytics Firm: Top LINK Investors are Accumulating
Per a recent report from analytics firm Santiment, the top Chainlink holders have been taking the recent consolidation phase as an opportunity to accumulate large positions.
“If this isn’t the depiction of steady accumulation for Chainlink’s top 100 non-exchange whales in the past year, we don’t know what is. LINK’s offline increase in tokens at this rate truly shows confidence in the asset from those with most at stake.”
Image Courtesy of Santiment.
It could be quite a while before Chainlink breaks its current accumulation phase and rallies higher, but when it does, it could see some immense gains that allow it to gain ground against Bitcoin.
Featured image from Unsplash.
Charts from TradingView.
Yearn.finance’s YFI token failed to gain any momentum following yesterday’s sharp rebound following a brief dip below $10,000.
The cryptocurrency is now on the cusp of once again breaking below this level, with the immense selling pressure coming about as open interest for the token reaches an all-time high.
Although the sell-side of YFI’s order books are rather thin at the moment, a lack of any intense inflows of capital has perpetuated its recent technical weakness – which is showing few signs of slowing down any time soon.
The governance token’s price is also dipping in tandem with the implementation of a new proposal to redirect the ecosystem’s income towards YFI token buybacks, which is widely expected to boost its price.
Investors don’t seem to care too much, however, as the selling pressure placed on the token has been relentless.
Unless it traps short positions and sees a more sustainable rally in the near-term, there’s a decent chance that significantly further downside is imminent.
Yearn.finance (YFI) Struggles to Gain Momentum as Descent Continues
At the time of writing, Yearn.finance’s governance token is trading down over 6% at its current price of $10,370.
Yesterday, the crypto rallied to highs of $12,000 following a dip to lows of $9,600 set just a few days ago.
This decline marked capitulation, and the subsequent rebound made many analysts suspect that this was a short squeeze that could help mark these lows as a long-term bottom.
However, the decline seen throughout the past day signals that this selloff is not over and that further downside may be seen in the days and weeks ahead.
YFI Open Interest Hits All-Time Highs as Traders Bet on Volatility
Open interest for Yearn.finance’s YFI token is now at an all-time high, which indicates that an explosive move could be right around the corner.
Prominent investor Andrew Kang spoke about this in a recent tweet, explaining that OI is surging following the move towards $15,000 that cleared the upside liquidity.
“OI on YFI at new ATHs, surpassing first capitulation at 12k earlier this month. 12k-15k liquidity capitulated into high volume at 10ks (same as first capitulation into 12ks. Sell side orderbooks thin. What happens to shorts on a bounce up?”
Although he seems to believe that this indicates a move higher is imminent, the lack of any short squeeze during yesterday’s relief rally seems to point to immense underlying weakness amongst bulls.
Featured image from Unsplash.
Charts from TradingView.
In the past week, altcoins prices received a significant haircut, and investors who were light on Bitcoin (BTC) saw their portfolio value take a hit.
Initially, Ether (ETH) price followed Bitcoin higher as the top-ranked digital asset rallied through the $12,000 resistance but as BTC continues to slowly push higher Ether struggled to flip $400 to support.
Crypto market weekly price chart. Source:Coin360
Ether’s loss of momentum and the correction in altcoins has led to a number of crypto traders tweeting that altcoin season is done and many are citing the bearish price action in the ETH/BTC pair as evidence for this point of view.
ETH/BTC 1-week chart. Source:TradingView
Looking at the ETH/BTC weekly chart, traders will notice that the pair is on the verge of dropping below the ascending trendline and high volume VPVR node at 0.027294 sats.
Losing this level opens the door for a further decline to 0.024519 sats and below this Ether is approaching yearly lows near 0.0160 sats.
ETH/BTC daily chart. Source:TradingView
On the daily timeframe, we can see that losing the 0.032385 sats support thrust Ether price into the VPVR gap from 0.032385 sats to 0.029536 sats.
The bleeding looks set to continue until the price reaches the 0.029536 sats level, but the current daily candle is beginning to form what looks like a double bottom and there appears to be an oversold bounce taking place as the RSI is rising from 28 on the daily timeframe.
The signal line and MACD of the moving average convergence divergence indicator are still in steep decline and the absence of strong buy volume decreases the chance that short-term trend-reversal is in the making.
Perhaps if Bitcoin price entered a period of consolidation for the next few days the ETH/BTC pair could recover some lost ground but this seems unlikely at the moment.
There’s hope in the ETH/USDT pair
ETH/USDT daily chart. Source:TradingView
The ETH/USDT pair paints something of a different picture as the pair continues to make daily higher lows and the price action is following the support and resistance trendlines of the ascending channel.
The channel support rides alongside the 100-day moving average and once Ether is able to hold $400 as support $405 and $417 are the next hurdles the altcoin must overcome.
The price action within ascending channels is pretty easy to track and the 4-hour chart shows the MACD converging with the signal line as the selling tapers off and the RSI is rising toward 45.
Over the short-term, a move to the ascending channel midline at $400 seems probable but traders still expect this level to be stiff resistance. A bullish breakout from the ascending channel ($430) could enable Ether to chase after the $468.
If Ether price drops below the 100-MA and falls from the ascending channel there is support at $353, $330, and $315. Losing these levels means traders can look for a sharper drop to $248.
The views and opinions expressed here are solely those of the author and do not necessarily reflect the views of Cointelegraph. Every investment and trading move involves risk. You should conduct your own research when making a decision.
A relatively recent transplant to Texas Sarah Herring heads to Prime Social Club to check out the inaugural Lonestar Poker Series. The series was started by Kim Stone who realized there was a hole in the poker community in Texas because no known tournament operators were willing to have a tournament in the market which is untested. After connecting with Prime Social Club & Justin Hammer, Stone and her fiancé Hayden Fortini started putting together the logistics of a fantastic tournament series in the Houston area. From the belt buckles and money clips created by local businesses, to the VIP guests coming for mixed-games you just can’t find anywhere, the Lonestar Poker Series did not disappoint. Every guarantee was almost doubled and we can not wait to see where this series goes in the future.
For Live Updates check out: https://www.pokernews.com/tours/lone-star/lone-star-inaugural-poker-series/
Bitcoin could be on the cusp of posting a move to fresh all-time highs if it can close its monthly candle today above one critical level.
The benchmark cryptocurrency has been caught within the throes of an intense uptrend throughout the past several days and weeks, with each selloff being fleeting and followed by it setting higher highs.
This type of price action shows that it is now in a clear bull market, and the fundamental and technical strength underpinning it at the present moment suggests new all-time highs could be on the table.
One analyst is stating that a monthly close above $13,900 could be all that it takes to rally significantly higher in the days and weeks ahead.
In 2017 during the peak of the bull run, Bitcoin’s price was rejected at $20,000 mid-way through the month, with its monthly candle for December closing below $14,000.
This means that tonight’s monthly candle close could be one of the most significant ones that Bitcoin has ever seen before.
Bitcoin Rallies to Fresh Post-2017 Highs as Bulls Maintain Control
At the time of writing, Bitcoin is trading up over 2% at its current price of $13,855. This marks a slight decline from its daily highs of $14,100 that were set overnight.
The cryptocurrency has not seen any sustainable declines since this uptrend first began, which is an incredibly positive sign that speaks to bulls’ current strength.
So long as buyers continue absorbing any intense selling pressure, there’s a strong likelihood that upside is imminent.
The key level to watch in the near-term is roughly $13,900, as a daily candle close above this level would allow BTC’s monthly candle to see its highest close ever.
Analyst: Break Above $13,900 Could Send BTC to Its All-Time Highs
Highlighting the importance of breaking and closing above $13,900, one analyst explained that he would not be surprised to see a rally to all-time highs of over $20,000 if Bitcoin’s monthly close takes place above this level.
“Lets close BTC above that green line on the monthly and send it to ATH,” he said.
Image Courtesy of Josh McGruff. Source: BTCUSD on TradingView.
Bitcoin bears have been vying to stop this from taking place, which means that it will require a significant influx of buying pressure in the coming hours for this crucial breakout to occur.
Featured image from Unsplash.
Charts from TradingView.
Bitcoin (BTC) price is undoubtedly having an impressive year after crashing to $3,700 in March but then rallying to $14,000 in the following months. Now BTC has reached the highest point since January 2018 as the price touched $14,100.
Thus, the likelihood of the new bull cycle is heavily increasing as the price of Bitcoin continues to make new higher highs and higher lows. What’s more, the strength is even seen while the U.S. Dollar Currency Index, with which it is typically inversely correlated, is also recovering amid coronavirus fears.
Bitcoin yet to break the $13,700-14,250 area
BTC/USD 1-week chart. Source:TradingView
The weekly chart shows some crucial levels to be watched in order to continue the bullish momentum. One of them is the current resistance zone surrounding the $14,000 threshold. Breaking through this resistance zone would initiate further strength toward the next threshold around $16,500-17,000.
These two levels are the final hurdles before a possible new all-time high, while the majority of altcoins are still facing huge losses compared to their 2017 peak highs.
There are two crucial levels to watch on the downside. The first and primary breaker is the $11,400-11,800 area. That’s been the crucial resistance zone for two years, which means it could see a retest before any more upside.
However, if that area is lost, the next support zone is found between $10,100-10,400. These two zones are critical to hold if the market is in bullish territory.
The highest monthly close ever is possible for Bitcoin
BTC/USD 1-month chart. Source:TradingView
As the monthly chart shows, the highest monthly close ever is possible for Bitcoin — an incredible accomplishment 12 years after the release of the whitepaper.
However, it also shows the significance of this resistance zone as it’s the last major hurdle before the all-time high can be challenged.
If $13,700-14,200 breaks, further continuation toward new all-time highs are almost guaranteed as there are not many levels standing in between.
However, the start of a new bull cycle is typically accompanied by accumulation periods, through which previous resistance zones are retested and confirmed as support. Such an accumulation period would mean Bitcoin’s price can correct toward $11,600 to find sufficient support before a major move up.
Current market behavior comparable to the 2016 cycle
BTC/USD 1-week 2016 chart. Source:TradingView
The 2016 chart shows these accumulation ranges through which a healthy trend was established. Every previous resistance level got retested for confirmation, after which a range was established to accumulate Bitcoin.
After such a range-bound construction, compression started to build up, ultimately resulting in a massive breakout.
Another massive signal is the quick buys during market corrections. These are shown by long wicks as buyers quickly step in to buy as price is falling. A similar move can occur if the market corrects in the coming weeks.
Possible scenario for Bitcoin price
BTC/USD 1-week scenario chart. Source:TradingView
The current area of $11,400-11,800 is a crucial resistance zone. If the price of Bitcoin falls to break through this resistance zone, a correction will become the likely scenario.
Therefore, Bitcoin’s possible scenario is range-bound action between $11,400 and $14,200. Such a sideways construction would be similar to the 2016 period of accumulation.
Ether and other altcoins may then show up to the part the moment Bitcoin finishes its correction and goes into the sideways range-bound construction. It will likely take a few more months before altcoins can start to move upward.
The views and opinions expressed here are solely those of theauthorand do not necessarily reflect the views of Cointelegraph. Every investment and trading move involves risk. You should conduct your own research when making a decision.
Bitcoin (BTC) is sucking up the volume from the entire cryptocurrency market as it continues to rally. This is causing the alternative cryptocurrency (altcoin) market to pullback, which has seen rising selling pressure and low buyer demand.
On Oct. 30, researchers at Santiment pinpointed the growing volume and dominance of Bitcoin, while Chainlink (LINK), Ether (ETH) and Binance Coin (BNB) struggled. They wrote:
“The dominance involving #Bitcoin is continuing to display itself, particularly via trading volume. When comparing other top blockchains in the past day, note the decline in $ETH, $XRP, $LINK, and $BNB trading volume, while BTC’s levels stayed high.”
At least in the foreseeable future, traders believe the so-called “altseason” is not returning, especially as Bitcoin outperforms altcoins.
The trading volume of Bitcoin against other major cryptocurrencies. Source: Santiment
When would altcoins recover?
Historically, during bull markets, the cryptocurrency market saw Bitcoin experience a rapid uptrend first. Then, altcoins followed, after BTC surged to a local peak or an all-time high.
Traders foresee a similar pattern playing out in the current price cycle, generally expecting altcoins to recover in 2021. But until BTC stabilizes and completes its rally, traders do not see a proper altcoin uptrend happening.
Since Sept. 13 lows, the Bitcoin dominance index has increased from 56% to 63.4%, recording a 7.4% increase within two months.
The Bitcoin dominance index. Source: CoinMarketCap.com
However, Michael van de Poppe, a full-time trader at the Amsterdam Stock Exchange, said an altseason in the first quarter of 2021 is possible. He said:
“Dominance hit the red zone here. Still waiting until December for a top structure on this one. After that -> Quarter 1 altseason.”
The problem with altcoins is the current dynamic of the cryptocurrency market. When Bitcoin rises quickly, altcoins fall as capital cycles back into BTC. If BTC drops, then altcoins drop in tandem, putting altcoins in a precarious position.
A pseudonymous trader known as “DonAlt” said he has been short Ether for several days. He said that if ETH does not recover against Bitcoin, then a broader altcoin market pullback is a possibility. The trader noted:
“I’ve been short ETH for a couple days now. That said ETHBTC is approaching support. So there is a good chance it bounces here, if it doesn’t the entire altcoin market gaps down quite aggressively.”
Similarly, a trader recognized as “CryptoCapo” said that the technical structure of altcoins is not compelling in the near term. For traders, that makes Bitcoin more attractive, given that it has portrayed strong momentum throughout October. He emphasized:
“Let’s be honest: There are alts that look really bad, alts that look decent, and alts that look good. I don’t see any altcoin that looks really good right now. Choose wisely.”
The key is for the Bitcoin rally to cool down
As long as the price of Bitcoin continues to surge rapidly and Ether lags behind, an altseason is highly unlikely in the near term.
The price of Ether against Bitcoin. Source: TradingView.com
A strong sign of an altseason would be a consolidation of the ongoing Bitcoin rally followed by a breakout in the price of ETH.
Considering that BTC/USD broke out of the $13,000 resistance level merely a week ago, technically, an Ether and altcoin market uptrend could still potentially be several months out.
So far, the capital in the altcoin market still seems to be shifting towards Bitcoin, however. As Cointelegraph reported, decentralized exchanges, or DEXs, have continued to bleed volume in October. This indicates that the demand for DeFi tokens is slowing down likely due to Bitcoin’s curren momentum.
The state’s Division of Gaming has released Colorado sports betting figures showing that over $200 million was wagered just in September. That’s up 61% compared to the month of August.
Despite the American football season ‘kicking off’, baseball was the sport with the most money wagered. More than $47 million of bets were placed, with football second, basketball third and then followed by hockey.
The activity added nearly $70,000 in taxes to state coffers, the division reported. The sports gambling industry debuted in Colorado on May 1st, and amid a pandemic that put a hold on many professional sports.
You can read more on Colorado sports betting at the Yogo Net website.
The price of Bitcoin (BTC) surpassed $14,000 on Oct. 31, the day Satoshi Nakamoto released the Bitcoin whitepaper in 2008. Since then, the world’s biggest cryptocurrency has seen remarkable and exponential growth across various areas.
The daily price chart of Bitcoin. Source: TradingView.com
Fast forward 12 years, since the October 31, 2008 release of the whitepaper, Bitcoin is in a different growth trajectory. An institutional craze is leading the BTC rally, major financial institutions are supporting crypto assets, and the market has become increasingly liquid.
The 12-year anniversary of the Bitcoin whitepaper is particularly special for Bitcoin because it marks the third post-halving cycle.
Every four years, Bitcoin undergoes a block reward halving, which cuts the rate at which new BTC is mined by half. This happens because 21 million BTC can ever exist on the blockchain. As BTC approaches its fixed supply, the rate of production gets slowed.
A halving historically has had a positive impact on the price of Bitcoin. It reduces the pace a new BTC supply is introduced to the market. Consequently, every four years, there is less BTC flowing into the exchange market.
The 4th, 8th, and the 12th anniversary of Bitcoin are more noteworthy than other anniversaries for this reason. It coincides with a post-halving cycle, as the latest halving occurred in May 2020.
The historic prices of Bitcoin on “whitepaper day” have seen considerable growth over the past decade. For example, in 2013, BTC price was just $204. In 2014, it reached $338m; 2015 – $314; 2016 – $700; 2017 – $6,468; 2018 – $6,317; and $9,199 in 2019.
BTC price rejected at $14,100
Across major exchanges, the price of Bitcoin reached a peak of $14,100 and saw an immediate rejection on Saturday, Oct. 31. Most of the selling pressure came from Binance, which caused the price to quickly fall by 3% within minutes.
Prior to the rejection, massive buy walls on Huobi and Binance initially pushed BTC upwards. There was a 1,371 BTC buy wall on Binance at $13,680 and another big buy wall at over $13,800 on Huobi.
A pseudonymous Bitcoin trader known as “CL” said it was the “biggest buy wall on Huobi I’ve seen in a long time.”
But as BTC surpassed $14,000, traders on Binance began to sell large amounts of BTC in a short period. Prior to BTC’s upsurge to $14,100, tech investor and Cointelegraph Markets contributor, Keith Wareing, wrote:
“Sadly, Bitcoin will rejected at $14k and go back below the 2019 high thanks to binance whales.”
What happens next?
When the price of Bitcoin surges rapidly and violently rejects, traders describe the pattern as a “darth maul candle.”
After such a large spike in volatility, Bitcoin tends to stabilize and consolidate. Considering that $14,000 is a crucial resistance level, BTC would likely consolidate under $14,000 and continuously attempt to break out.
CryptoQuant, the on-chain market data provider, has been pinpointing that Bitcoin exchange deposits have been declining. That typically indicates declining selling pressure, particularly among retail investors and whales.
According to Ki Young Ju, the CEO of CryptoQuant said the trend is considered a “long-term buy signal.” The lack of intent to sell from investors on exchange indicates that a prolonged uptrend has become more likely.
An optimistic market sentiment supplemented with strong fundamentals and various positive technical factors is only fitting on Bitcoin’s 12th anniversary.
You really need to get involved in the trio of promotions featuring in our Three Promos to Watch article if you are a fan of adding value to your poker session. We don’t know any poker player who doesn’t like some added extras when it comes to playing this crazy game and boy do we have some excellent promotions for you this week.
The Unibet Poker €40,000 Flop Races
Cash game players have their own special promotion taking place at Unibet Poker. The €40,000 Flop Races started on October 12 and continue through to November 15.
As the name suggests, the promotion revolves around seeing flops in cash games. You receive leaderboard points for every flop you see. The more flops you see, the more points you get your hands on, and the more likely it is you’ll win a prize.
More points are awarded for seeing flops in higher stakes games, but you’re not at a disadvantage by playing lower stakes. This is because Unibet Poker has split the €40,000 Flop Races leaderboards into three, each based on the stakes played for. This means you’ll only be competing against Unibet Poker players who frequent similar games to yours.
Multiplier
Low
Mid
High
1
NL10, Banzai €20
NL50
NL200
1.5
PL10, NL25
PL50, NL100
PL200, NL400
2
PL25
PL100
PL400
You also receive bonus point each time you see 100 flops in a day. Unibet Poker gifts you 20 points for hitting this total.
Don’t worry if you’re having a tough time at the tables because Unibet Poker has your back. You bank a point for every euro you lose at the tables each day, up until you reach the daily cap.
Low: €10/10 points
Mid: €50/50 points
High: €200/200 points
Find out more about the €40K Flop Races
Win Your Way Into the Inaugural EPT Online Main Event
PokerStars is hosting the first-ever European Poker Tour (EPT) Online festival. With live poker festivals up in the air right now, PokerStars has decided to run an online version of the long-running EPT.
EPT Online runs from November 8-18 and it is the $5,200 buy-in Main Event that has everyone talking, not least because it has a massive $5 million guarantee on its prize pool.
$5,200 is a lot of money for the majority of poker players to fork out on a single tournament so PokerStars is running dozens of satellites. There’s a satellite for every PokerStars player, regardless of the size of their bankrolls.
The $530 buy-in satellites are where the $5,200 EPT Online Main Event seats can be won, but you can win your way into these bigger sats via $5.50 games.
Buy-in
Guarantee
$5.50
3-5 x $55 Satellite Seats
$11
3 x $109 Satellite Seats
$55
3 x $530 Satellite Seats
$109
3 x $530 Satellite Seats
$530
2 x $5,200 EPT Online Main Event Tickets
The EPT Online Main Event is going to be spectacular. Will you be part of the action?
Find out more about $20M Gtd EPT Online Festival
Turn $5 Into $1 Million In Minutes at partypoker
SPINS are partypoker’s take on jackpot sit & go tournaments, where the prize pool is randomly determined before the first hands are dealt.
You’re prize pool multiplier will be at the lower end of the scale in the majority of SPINS you play, but partypoker’s $5 buy-in games make it possible to win $1 million and in a matter of minutes thanks to the hyper-turbo structure.
Hitting the 240,000-times multiplier is rare but it’s definitely worth the wait. Triggering it guarantees you at least $100,000 because all three entrants are paid when the multiplier is 120x or above. Taking down a SPINS tournament with the top multiplier awards you with a massive $1 million payout!
Two players have won the $1 million jackpot so far, will you become number three?
Gareth James is a tournament poker player, author, coach, content creator and streamer. He currently grinds the off-peak Sunday schedule over on Twitch and you can find his regular strategy content, for free, over on Youtube.
I’ll start this article off by saying I love Holdem Resources Calculator (HRC), I’ve used it for many years and regularly recommend it to my students.
However, recently I’ve seen some content from well-known, respected poker players, authors and streamers who seem to be suggesting that it can give you good opening ranges and responses to those ranges including good, solid BB defence strategies and I’m a bit concerned. Mainly because I know that HRC cannot do these things as it doesn’t factor in equity realisation.
HRC is great and I use it regularly, but definitely not for working out opening ranges or response ranges. In this article I’m going to just focus on BB defence at 20bb and compare the results of both Holdem Resources Calculator and Simple Preflop Holdem.
READ MORE: 7 Tips to Take Your Poker Game From “Meh” to Amazing
What is Equity Realisation?
First let’s talk about equity realisation, what it is and how we know HRC doesn’t use it.
Equity realisation is how much of the pot a hand can expect to make (as a percentage) based on raw equity AND many other postflop variables including, but not limited to:
Whether you’re in or out of position
The type of hand you have (a suited hand like 76s will realise equity better than K2o for example)
The skill level of your opponent (e.g. will they find enough aggressive moves that will prevent you from seeing turn and river cards?)
The key thing here is the fact that it relies on postflop variables.
Now even if we take out the skill level of your opponent, it will hopefully be clear already that in order for a solver to solve properly, it will need to factor in these postflop variables. Sadly, HRC does not. It essentially believes that after the final preflop action where neither player is all in (so there is an opportunity for postflop betting to take place) the hand just gets checked to showdown, something which rarely happens or at least is rarely strategically optimal.
Putting Theory into Practice
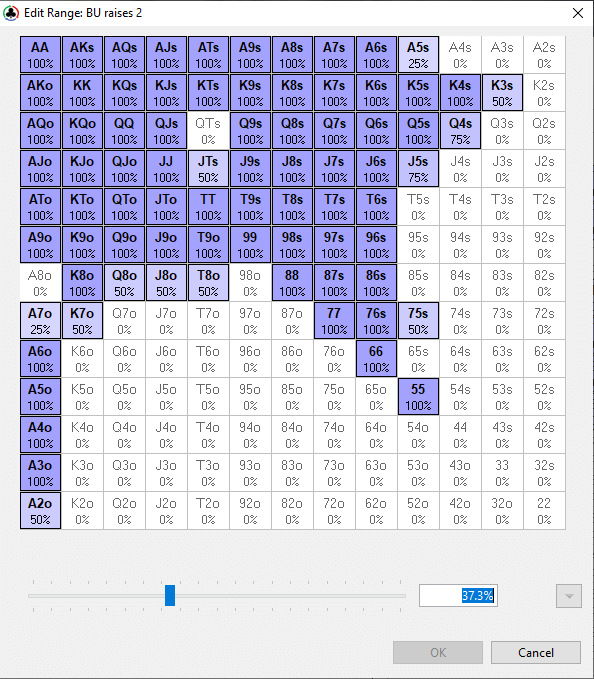
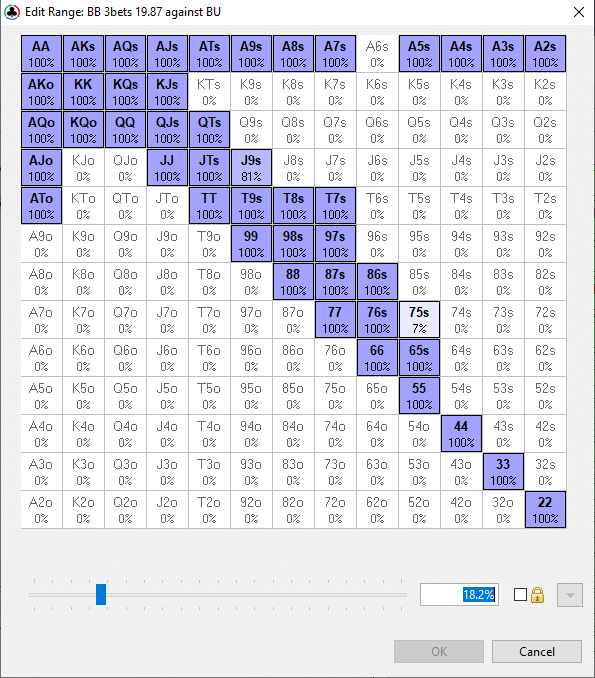
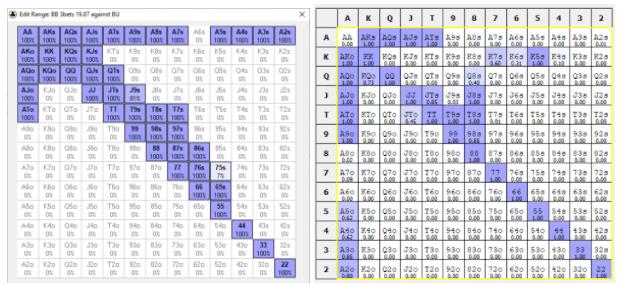
Let me give you an example. Nine players at the table, everyone has 20bb, the blinds are 0.5bb/1bb with an ante of 0.13bb and it folds around to the BTN who opens for a minraise. For this example, I’ve run an advanced hand where I’ve edited the range for the BTN to see what Holdem Resources Calculator suggests the BB can call and 3-bet jam versus this open.
20bb BTN min-raising range (HoldemResources Calculator)
This is the result:
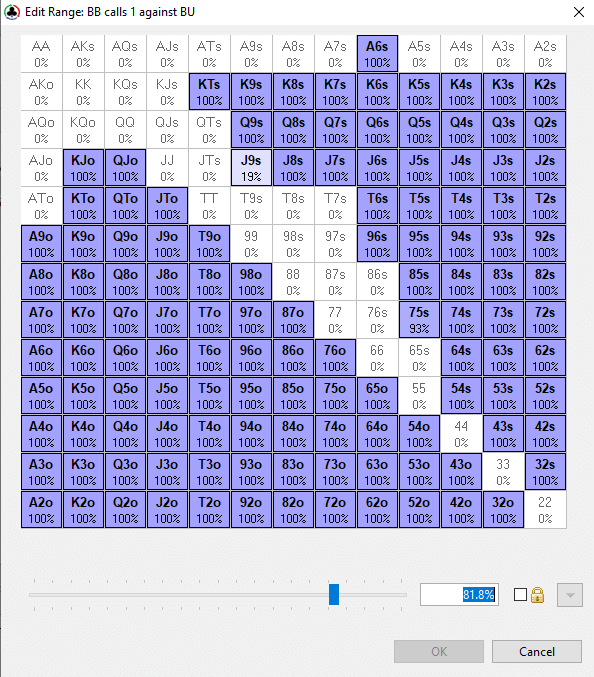
20bb BB calling range (81.8%) vs BTN minraise (HoldemResources Calculator)20bb BB 3-bet jamming range (18.2%) vs BTN minraise (HoldemResources Calculator)
As you can see it’s suggesting playing 100% of hands: calling 81.8% and 3-bet jamming 18.2%. Now you could be the best player in the world postflop, but I still don’t think you’re going to be able to play 72o well enough where it’s actually going to make money as a call.
So what’s going on here?
When the BTN opens for a minraise there are 4.67BBs in the middle and it costs the BB just 1BB to call. Thus, they’re getting 4.67:1 odds which is about 17.6%.
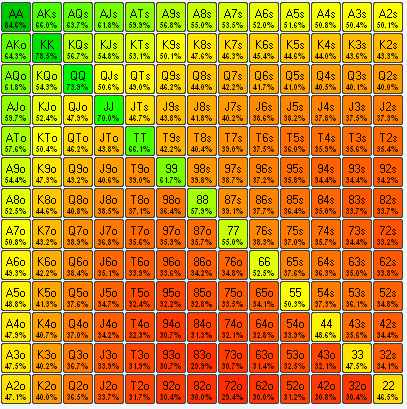
Heatmap from Power-Equilab showing the equity of each hand versus the BTN opening range
As you can see, every single hand has enough equity to make the call here, which is why HRC is suggesting playing 100% of hands. 72o, though, does a really poor job at realising equity. In order to profitably call, you would have to realise more than 60% of your equity with 72o, something that just isn’t going to happen.
READ MORE: What Is Real-Time Assistance (RTA)? Is it Legal?
Button vs Big Blind
To better illustrate this point, here’s a table of selected hands for this spot 20bb BTN vs BB to look at how different hands do at realising equity, sorted by those that realise the best. For a hand to be a profitable call the equity x equity realization has to be higher than 17.6%.
Now all of the hands in this table will make the grade, simply because I only included profitable hands in the BB defence range when running the reports in Piosolver in the first place. The key thing to focus on here is how some hands do better than others at realising equity. Suited hands will always do better than their offsuit counterparts. Connected hands will always do better than unconnected hands. K4o, while having a lot more raw equity than 32s, does a lot worse in terms of equity realisation.
Hand
Equity (%)
Equity Realization (%)
A9s
57.27
113.44
KJs
53.98
102.79
QJs
49.68
101.12
J9s
43.21
94.6
76s
39.19
91.13
A8o
53.38
90.87
32s
34.45
90.71
KJo
51.49
87
T2s
35.08
83.08
98o
36.18
80.36
QTo
45.54
79.94
T8o
36.79
74.87
K8o
44.79
67
Q6o
39.26
60.88
J3o
33.55
59.43
K4o
40.19
56.94
Q5o
38.11
56.44
Simple Preflop Holdem
So if HRC doesn’t give us a usable solution, how do we solve this problem?
Enter… Simple Preflop Holdem.
Simple Preflop Holdem is a preflop solver that factors in equity realisation by considering some of the postflop variables we discussed earlier – namely postflop betting and position.
I’ve used exactly the same opening range for the BTN and once again given the BB the options to 3-bet jam, call or fold. Here’s the result from Simple Preflop Holdem this time:
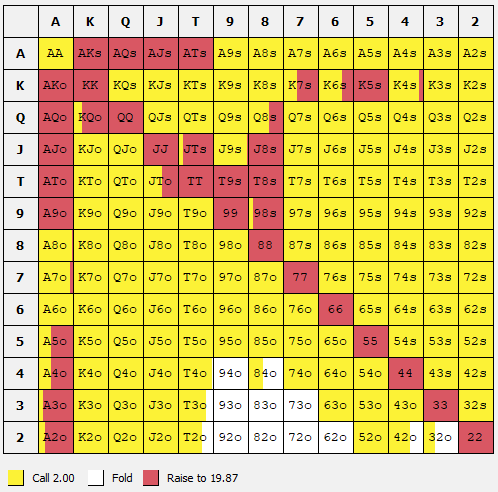
20bb BB vs BTN minraise strategy (Simple Preflop Holdem)
Let’s take a look at the calling and 3-bet jamming strategies side by side for comparison.
20bb BB calling ranges vs BTN minraise (HoldemResources Calculator left vs Simple Preflop Holdem right)
As you can see there are some big differences, mainly with suited hands. Simple Preflop Holdem does a lot more calling with suited broadways and suited Aces, hands that HRC likes to jam, but then just folds hands like 94o, 93o and 73o, which HRC likes as a call.
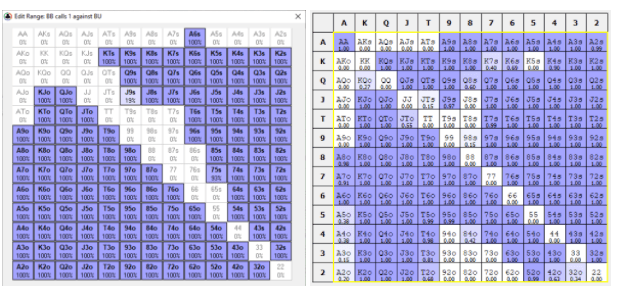
20bb BB 3-bet jamming ranges vs BTN minraise (HoldemResources Calculator left vs Simple Preflop Holdem right)
Again there are some differences here. Simple Preflop Holdem likes to jam the weaker offsuit Ax hands more frequently, but then flats hands like AA, QTs and T7s that HRC likes to jam. What Simple Preflop Holdem is essentially doing here is telling us that it believes it’s a higher EV play to just call Aces than it is to jam and the same goes for other hands like KQs, A5s and T7s. You can clearly see equity realisation being utilised here to give a better strategy where the EV of both lines are compared and the better one is recommended.
In Conclusion
HRC is good for many things, especially push/fold in cEV and $EV situations at 8bb and under, but it can’t give you solid BB defence strategies that you can use in your own game so please don’t use it for that. When we think about which hands to flat and which hands to 3-bet jam, we should always be thinking about which line will generate the higher EV. We also need to make sure we’re making +EV decisions in the first place and not blindly following the HRC readout and calling with 72o and 94o.
Are you a Game Changer or just a player? Boost your ROI with just a few hours a month without breaking the bank by joining MTT Game Changer, a group coaching program for low to midstakes players and bankrolls by clicking here.
It’s been a brutal past few days and weeks for altcoins despite Bitcoin’s strength. Top digital assets aside from BTC have plunged a handful of percent, even dozens of percent, against the U.S. dollar, even as Bitcoin hits new year-to-date highs.
This divergence has shocked many investors in the space, especially those that entered the altcoin market late this summer. This pain may eventually end, though, an analyst noted. This same individual added that this may coincide with BTC breaking $14,000.
Related Reading: Here’s Why Ethereum’s DeFi Market May Be Near A Bottom
Bitcoin to Break $14,000 Once Altcoin Hemorrhaging Ends
Bitcoin analyst “Light,” who is celebrated by fund managers like Su Zhu of Three Arrows Capital, thinks that Bitcoin could soon break above $14,000 once the market sell-off ends:
“BTC is behaving in an incredibly strong fashion, up 0.9% l24hrs while alts hemorrhage and derisking continues in equities. Expect it to break $14,000 after the bloodletting runs its course.”
BTC is behaving in an incredibly strong fashion, up 0.9% l24hrs while alts hemorrhage and derisking continues in equities.
$14,000 has long been a critical technical level for the leading cryptocurrency. It almost perfectly marked the highs of 2019’s rally, and also is in the vicinity of where Bitcoin closed its yearly candle at the end of 2017. Bitcoin moving above, then closing on a notable time frame on $14,000 will likely suggest the cryptocurrency will move dramatically higher.
Real Vision CEO Raoul Pal recently commented that $14,000 and $20,000 are the only two technical levels stopping new Bitcoin all-time highs.
Analysts assign much more importance to $14,000 than they do to $20,000 due to the amount of trading volume around the former price level.
Related Reading: Tyler Winklevoss: A “Tsunami” of Capital Is Coming For Bitcoin
Altcoins to Bounce
Altcoins are expected to bounce once Bitcoin begins to consolidate or distribute and once global markets turn risk-on once again.
The fundamentals of certain altcoins are stronger than ever. Case in point: the total value locked in decentralized finance (DeFi) contracts recently hit a new all-time high above $12 billion, around five times higher than this metric was in June.
Analysts expect these fundamentals to eventually translate into price action in the DeFi market.
Other altcoin sectors have also shown fundamental strength. Though, whether enough this will allow altcoins to outperform Bitcoin remains to be seen.
Related Reading: 3 Bitcoin On-Chain Trends Show a Macro Bull Market Is Brewing
Featured Image from Shutterstock
Price tags: xbtusd, btcusd, btcusdt
Charts from TradingView.com
Expect Bitcoin to Break $14,000 Once Altcoin Bleeding Ends: Analyst
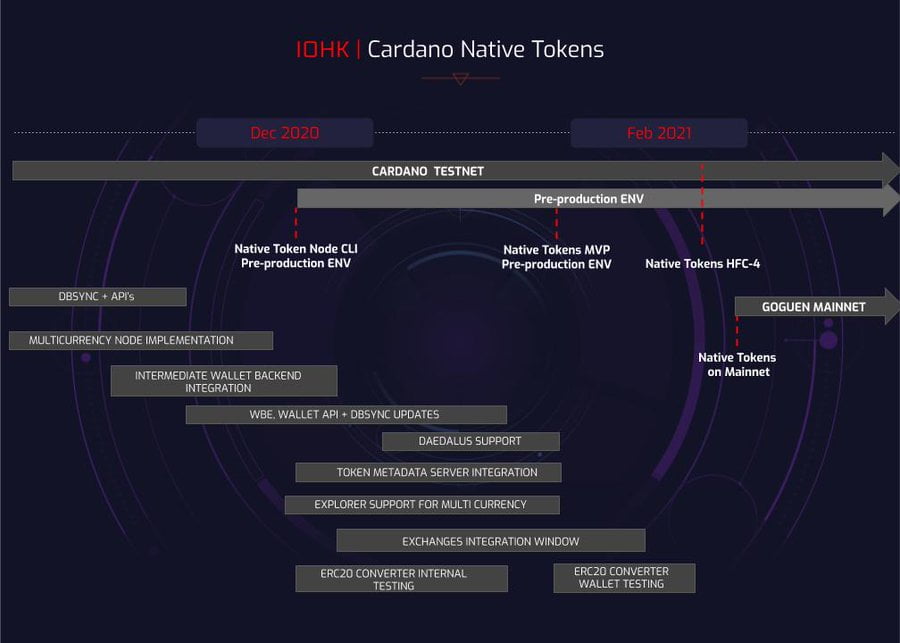
IOHK fired up the Cardano community by releasing details of the Goguen roadmap yesterday. After the successful rollout of Shelley, many look to Goguen as the final hurdle before challenging Ethereum on level ground.
The roadmap puts the Goguen mainnet launch at around March 2021. Considering the frequent delays to Shelley, this represents an ambitious but welcome call.
Goguen is a significant leap forward in the capabilities of the Cardano network. With it comes the ability to build decentralized applications and a whole host of other features, including a multi-asset ledger.
Developers, IOHK have gone to great lengths to cater to both technical and non-technical users. This will see the use of a new smart contract language in Plutus. It gives programmers a smart contract platform with functionality built into, or “native” to, the ledger itself.
“It also allows one code base to support both on and off-chain components, improving the coherency and usability of the development experience compared with existing smart contract implementations.”
This contrasts with Ethereum’s ERC-20 “contract standard,” which works through copy-pasting proforma code and modifying it to fit requirements.
There are several advantages to Plutus, including wider interoperability with other smart contracts. But the critical difference is that Goguen allows for smart contracts to be written in different languages. In comparison, Ethereum smart contracts use Solidity only.
As well as that, there’s Marlowe, a high-level domain specific language (DSL) built on top of Plutus. It will enable everyday people with no technical expertise to create smart contracts. Cardano hopes this will cultivate a new class of enterprise-level smart contract development with real-world use.
Who Is Jumping The Ethereum Ship?
IOHK released Goguen’s details via the Cardano Development October Update hosted by Marketing & Communications Director Tim Harrison.
The update included a section on the up and coming ERC-20 converter, which encourages Ethereum ERC-20 projects to port over to Cardano.
During the broadcast, Vukašin Vukoje, the former COO of Tenderly, an Ethereum monitoring platform, demonstrated using the ERC-20 converter. It showed options for converting BAT, DAI, AGI, USDC, and USDT.
“There are three ways in which our partner can convert their tokens. The first one would be by airdropping on the destination network, basically cloning the token. The second one would be by burning the token on the source network and creating one on the destination network. And the third one would be by locking the token on the source network and releasing it on the destination network.”
Source: youtube.com
SingularityNET CEO Ben Goertzel has already spoken about his reasons for moving AGI tokens from Ethereum to other blockchains.
But the real surprise was the inclusion of DAI, USDC, and USDT. What’s more, as stablecoins, does this give insight into Cardano’s DEX ambitions?
The end of Q1 2021 represents a pivotal period in Cardano’s development. Not only is Goguen scheduled for rollout, but IOHK CEO Charles Hoskinson estimates the network will be fully decentralized by then as well.
Bitcoin, although a powerful and disruptive financial technology, at its core, is mere mathematics. Its code is what keeps the network operating, its supply hard-capped at 21 million BTC, and much more.
But could that computer code and supply mechanism also help provide clues to when the crypto market tops and bottoms? According to a strange correlation with the asset’s block reward halving and the timing of tops and bottoms, the solution could be nothing more than simple addition and subtraction.
Adding Up All The Reasons The Bitcoin Bull Run Is Here
All signs point to Bitcoin breaking into a new bull market after bottoming now nearly two full years ago. A higher low set this year on Black Thursday during one of the worst selloffs the young asset has ever seen was one half of the equation in confirming a new uptrend.
The other half of the puzzle is a higher high, which Bitcoin this week came just dollars away from setting.
Related Reading | Bitcoin RSI Moves Into Bull Market Territory, Here’s What Happens Next
The cryptocurrency is now trading a few hundred dollars away and declining, however, another higher high this year post-election, or at the start of 2021 is still very likely.
Bitcoin for the first time this week since 2019 entered bull market territory on the weekly RSI – yet another signal that its clear skies again for the crypto asset once it cracks $14,000.
Could crypto tops and bottoms be related to the halving also? | Source: BLX on TradingView.com
Can Math Plus The Halving Subtract The Stress Out Of Timing Crypto Market Tops and Bottoms?
Bitcoin’s bottom is now two years behind us, and even the halving is now in the past. All the necessary ingredients are here for the perfect storm bull market for cryptocurrencies.
But the time distance between those two important events could provide a solution to predicting when the next peak in Bitcoin arrives.
Timing tops and bottoms isn’t easy and should be avoided at all costs. But once the bottom is in, there is a chance of perfectly timing the top, according to one crypto analyst’s striking discovery.
Related Reading | Bloomberg Intelligence Strategist Hints At Bitcoin Bull Run In 2021
They have found that the distance between each Bitcoin bottom and the block reward halving, just so happens to have been nearly the exact distance from the halving to the top (pictured above).
Other crypto analysts fact-checked the data and found it to be within 2% accuracy, suggesting there is possibly credence to the analyst’s speculative conclusion.
If they are correct, that puts the next Bitcoin peak at roughly eleven months away, on October 4, 2021.
Featured image from Deposit Photos, Chart from TradingView.com
As the weekend approaches, Bitcoin (BTC) price appears set to close out the month with a remarkably strong performance which has many bulls calling for a new all-time high above $20,000 in the near future.
Traders attribute these lofty estimates to the fact that BTC appears to have flipped $12,000 to $12,500 to support and barring some unexpected price implosion, Bitcoin is on the path to painting a beautiful monthly candle.
Crypto market weekly price chart. Source:Coin360
Further ‘bullish’ evidence comes from today’s options and futures expiry which saw $450 million of futures open interest expiring as of Oct.28.
According to Cointelegraph contributor Marcel Pechman:
“The most recent options expiry for BTC and Ether really provided nothing surprising. Deribit is back to 137K BTC options versus the 150K open yesterday. Meanwhile, CME has $215 million futures open interest expiring on Oct. 30, but this appears to have had a very minimal impact on price, if any at all. Once again, the phenomenon of the pre and post BTC price drop on the occurrence of CME futures expiries no longer exists. This reaffirms the bull case for the recent run, despite the negative news from Asian exchanges and Tether.”
Currently, BTC is trading above $13.5K, and the 4-hour chart shows the digital asset making higher lows and lower highs as the price pulls into a tighter range.
BTC/USDT 4-hr chart. Source: TradingView
Even as the price holds above the 20-day moving average, it wouldn’t be unexpected to see it range between $13,500 to $12,900 through the weekend and into early next week.
If Bitcoin price is able to push above the pennant trendline at $13,620 and secure a 4-hour close above it, then a renewed push for a new 2020-high above $13,859 is possible.
Currently, as trading volume increases, the moving average convergence divergence indicator shows the MACD has crossed above the signal line (orange) and the histogram shows an increase in momentum. The RSI is also above the midline, just reaching 60, but for the last few days, BTC has met resistance at $13,660.
In the event that BTC loses its current momentum and drops from the pennant below $13,100, there is support at $12,800. Failure to hold at this level opens the door for a retest of the next support at $12,000 and below this $11,500.
Bitcoin daily price chart. Source:Coin360
From a bird’s-eye-view, Bitcoin’s current price action is encouraging and the digital asset is clearly in a strong uptrend with room to run higher.
The same cannot be said for altcoins which have taken an absolute pummeling throughout this week. At the time of writing Ether (ETH) price is down by 5.8% as the top altcoin struggles to reclaim $400 as support. Chainlink (LINK) has dropped 6.74% and Binance Coin (BNB has lost 6.10%.
According to CoinMarketCap, the overall cryptocurrency market cap now stands at $396.6 billion and Bitcoin’s dominance rate is 63.5%.
Ethereum is in the process of trying to reclaim its key $380 support level following a brief dip below it earlier today.
The cryptocurrency has been struggling to gain any momentum despite the intense strength seen by Bitcoin as of late, which is currently grinding up towards its key resistance at $13,800 as buyers maintain full control over its price action.
Although BTC and ETH have been highly correlated in the past, they are now trading fully independent from one another.
This correlation only returns when BTC is showing signs of weakness, which places immense pressure on Ethereum.
The weakness seen by ETH as of late is particularly transparent while looking towards the cryptocurrency’s Bitcoin trading pair.
One analyst is noting that ETH/BTC has now reached a bedrock support level that he has been watching for quite some time. A strong defense of this level could confirm it as a long-term bottom and help catalyze a strong rebound in the days ahead.
Conversely, a break below this level would be dire.
Ethereum Struggles to Match Bitcoin’s Momentum as Bulls Try to Reclaim $380
Earlier this week, Bitcoin faced a dire rejection at $480 that caused its price to see some immense short-term weakness that has since been erased.
Before this rejection, Ethereum was stable within the lower-$400 region. The subsequent BTC decline to lows of $12,800 caused ETH to reel all the way down to lows of $370.
It is now in the process of trying to reclaim its $380 support level but remains well below its multi-week highs of $420, while Bitcoin is just a stone’s throw away from setting fresh 2020 highs.
It is unclear when or if there will be a rotation of capital out of the benchmark cryptocurrency and back into altcoins.
Trader: ETH Reaches Critical Support Level
One trader explained in a recent tweet that Ethereum has now reached what he describes as a crucial support level on ETHBTC that he has been watching for quite some time.
He said that he is now lightening up on his bearishness and will reassess once the monthly candle closes tomorrow.
“I’ve been short biased (&short) ETH for quite a while now anticipating weakness into the monthly close. That has largely played out. Now that we’re hitting supports on the ETHBTC chart I’m going to lighten up and reassess once the monthly chart has actually closed.”
Image Courtesy of DonAlt. Source: ETHUSD on TradingView.
Unless Bitcoin dives lower in the near-term, there’s a possibility that Ethereum will start bottoming out and recoup some of its recent losses.
Featured image from Unsplash.
Charts from TradingView.
On Nov. 3, either Donald Trump will win re-election, or Joe Biden will take over office and become the 46th president of the United States. In this two-part series, PokerNews will gaze into the crystal ball and try to divine what effect either candidate’s victory will have on the future of online poker in the U.S.
Based on his established track record over the last four years, it looks like a Donald Trump victory in the election would be a clear negative for the future of online poker in the U.S.
What about his opponent, the favored Joe Biden?
Thinking Back to 2011
In this case, there isn’t as much to go off as the precedent set by the Trump Administration’s re-interpretation of the Wire Act.
The aforementioned revisiting changed a previously published opinion from the Department of Justice dating to 2011.
“The text of the Wire Act and the relevant legislative materials support our conclusion that the Act’s prohibitions relate solely to sports-related gambling activities in interstate and foreign commerce,” wrote Assistant Attorney General Virginia A. Seitz.
That allowed online poker to fall outside the bounds of the Wire Act and paved the way for the growing legalized U.S. market as we know it today, which has four states actively spreading online poker with a fifth, Michigan, set to begin in the near future.
It’s worth noting that the sitting president in 2011 was Barack Obama, which means Biden was vice president during this sea change that enabled the ball to get rolling. That doesn’t necessarily mean Biden will be all in on iGaming legislation at the federal level, especially in the current environment that has far more pressing issues, but it’s at least an encouraging sign.
Check out PokerNews’ US Legislative map to learn the outlook of poker in your state!
More Recent, Concrete Hints
Biden has recently gone on the record with some quotes that offer some reason for optimism with regard to his attitude to possible expansion of iGaming legislation.
In December, his campaign released a statement during his visit to Las Vegas saying he “doesn’t support adding unnecessary restrictions to the gaming industry like the Trump Administration has.”
Another quote posted in a recent story from Online Poker Report runs along the same lines:
“I would reverse the White House opinion that was then reversed and overruled by the court. The court is correct. That should be the prevailing position.”
Possible Snowball Effect
iGaming industry expert Steve Ruddock told PokerNews that if Biden is elected, a new attorney general will be installed and it’s unlikely the new AG would be interested in investing time and resources into yet another re-interpretation of the Wire Act.
Most likely, they’d just direct the government to drop the case, meaning the feds would get out of the states’ hair on the issue and let them do as they please.
“It’s not realistic to hope that either candidate would do anything to legalize online gambling at the federal level,” wrote Dustin Gouker for OPR. “However, restoring the status quo, ending federal meddling and leaving matters up to the states would constitute a win at this point in time.”
iGaming legislation has picked up an incredible amount of steam in recent years thanks in large part to the 2018 Supreme Court decision that allowed sports betting outside of Nevada. Online sports betting was a natural offshoot of that as operators looked to maximize their profits, and 13 states to date have legalized online sports betting.
And as Ruddock pointed out, the current momentum continuing would create something of a snowball effect. The more states that legalize online gambling of any kind, the more difficult it is for the federal government to put a stop to things with a Wire Act interpretation like the one that came down under Trump. It’s a certainty that the states would fight tooth and nail to hang onto their newfound tax revenues, as New Hampshire has taken the lead on with its ongoing lawsuit.
Whether online poker specifically would be able to take advantage is a whole different story as states focus on more lucrative verticals of sports and casino. However, the door would at least be cracked and a Biden presidency wouldn’t be trying to slam it shut.
Photo courtesy of Petty Officer 1st Class Chad J. McNeeley/Wikimedia Commons